

On this page
Introduction – RAM Is Evidence Too
When people think about digital forensics, they often think about hard drives, deleted files, and browser history. But a running computer also holds a second source of evidence: memory.
RAM can reveal processes, command lines, network connections, loaded modules, credentials-related artifacts, and fragments of data that may disappear once a system is shut down.
In this lab, I created a small Windows activity scenario, captured the system’s memory, and investigated it step by step using Volatility.
Responsible-use note: This investigation was performed entirely inside a VM I created and control for this experiment, the target system, the activity, and the memory capture were all mine. Never acquire memory from a system you do not own or are not explicitly authorized to examine. In real investigations, memory acquisition also requires proper legal authority and documented chain-of-custody handling; this lab is for learning the technical process, not a substitute for that.
What Memory Forensics Can Reveal
A memory image can contain far more than a simple list of running programs. Because RAM stores information that the operating system and applications are actively using, it can preserve evidence that may never be written permanently to disk.
During a memory forensics investigation, analysts may be able to recover information such as:
- Running processes – programs that were active when the memory image was captured.
- Recently terminated processes – some process structures may remain in memory even after a program has exited.
- Command-line arguments – useful for understanding how a process was launched and what options or commands were used.
- Parent-child process relationships – these can help reconstruct how one process started another and identify unusual execution chains.
- Network connections – active or recently used connections can reveal which processes communicated with local or remote systems.
- Loaded DLLs and modules – useful for examining what code a process had loaded into memory.
- Registry-related artifacts – portions of the Windows Registry may be present in RAM and can provide additional system or user context.
- Strings and fragments of user activity – memory can sometimes contain URLs, commands, text, filenames, or other temporary data.
- Suspicious memory regions – in some investigations, memory analysis can reveal injected code or unusual executable regions that may not appear clearly during disk analysis.
However, none of these artifacts should normally be interpreted in isolation.
A process named powershell.exe, for example, does not automatically mean something malicious happened. A network connection by itself also does not explain why that connection existed.
The real value of memory forensics comes from correlating multiple artifacts.
A process list might show that PowerShell was running. A process tree might show how it was launched. Command-line data might reveal what it was asked to execute. Network artifacts might then show whether that process communicated with another system.
Together, those pieces can form a much stronger explanation than any single artifact alone.
Memory forensics is not about running one command and finding “the answer.” It is about correlating multiple artifacts to reconstruct what was happening on the system.
The Lab Environment
For this investigation, I created a small isolated lab using a Windows virtual machine as the target system and a Linux-based analysis machine for examining the captured memory image.
The goal was to generate a controlled set of normal user activities, capture the system’s RAM, and then investigate whether those activities could be reconstructed from memory artifacts.
Lab Components
| Component | Purpose |
| Windows VM | Target system where the activity scenario was created |
| Kali Linux | Analysis system used to examine the memory image |
| WinPmem | Memory acquisition tool used to capture the Windows system’s RAM |
| Volatility 3 | Memory forensics framework used to analyze the captured image |
| VMware virtual network | Provided an isolated virtualized environment for the experiment |
The target system was a Windows 11 Enterprise Evaluation virtual machine. The Windows VM was used to create a simple scenario involving normal user activity such as opening Microsoft Edge, launching PowerShell, running several harmless commands, and entering text into Notepad.
The analysis was performed from a separate Kali Linux virtual machine. After the memory acquisition was completed, the captured RAM image was transferred to Kali and analyzed using Volatility 3.
The separation between the target and analysis systems was intentional. The Windows VM represented the machine being investigated, while Kali acted as the forensic workstation. This prevented the analysis tools themselves from unnecessarily altering the target environment after acquisition.
Establishing Ground Truth
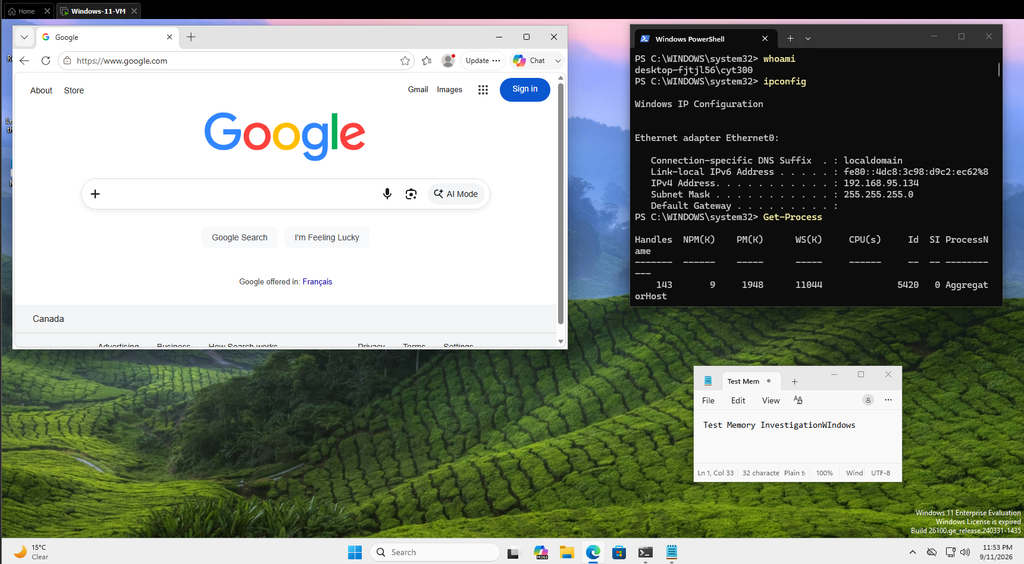
Before capturing memory, I intentionally generated a small amount of known activity on the Windows system.
Microsoft Edge was opened and used to access Google. PowerShell was then used to run:
whoami
ipconfig
Get-Process
At the same time, Notepad contained the unsaved text:
Test Memory InvestigationWindows
These applications were deliberately left open when the memory image was acquired.
Because I created the activity myself, I already knew what should potentially be present in memory. This provided a ground truth for the investigation.
Instead of asking whether an unknown compromise had occurred, the experiment asked a more controlled question:
How much of this known activity can be reconstructed using only the captured contents of RAM?
This distinction is important because memory forensics does not guarantee that every activity performed on a system will remain recoverable. By comparing the forensic results with known ground truth, it becomes possible to see both what memory preserved and what it did not.
Capturing the Windows Memory Image
Once the controlled activity scenario was prepared, the next step was to capture the contents of the Windows system’s RAM.
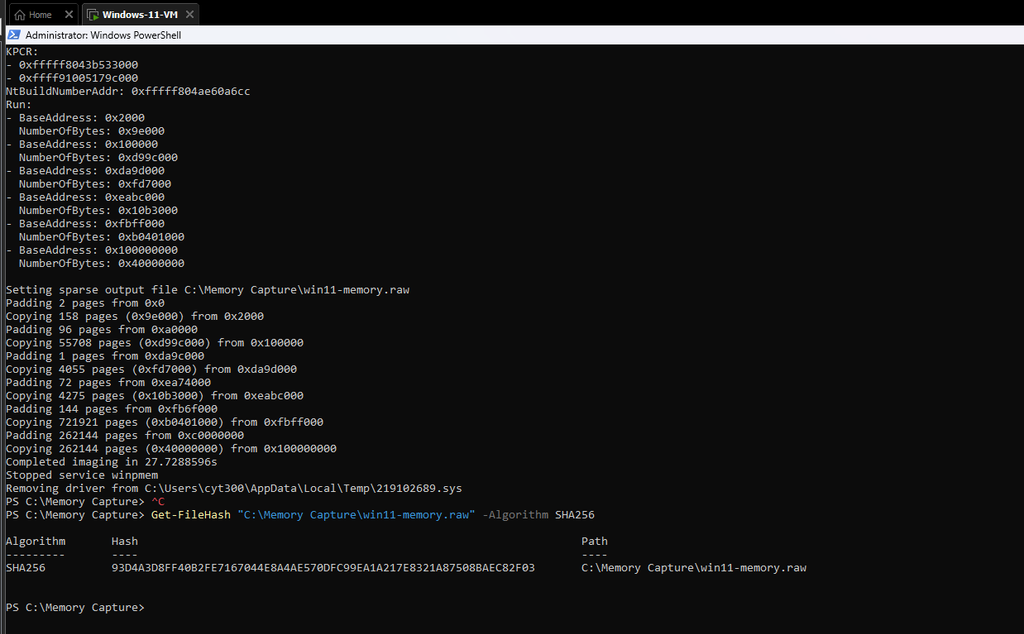
For this experiment, I used WinPmem, a Windows memory acquisition tool designed to create a forensic image of physical memory.
The memory capture was performed while Microsoft Edge, PowerShell, and Notepad were still open. This was important because RAM is volatile: its contents change constantly, and shutting down or restarting the system could destroy evidence that existed only in memory.
The acquisition command was executed from an elevated PowerShell session:
.\go-winpmem_amd64_1.0-rc2_signed.exe acquire "C:\Memory Capture\win11-memory.raw"
WinPmem then created a raw memory image named:
win11-memory.raw
The resulting image was approximately 5 GB, corresponding closely to the amount of memory allocated to the Windows virtual machine.
The acquisition completed successfully, after which the WinPmem driver was removed from the system.
Verifying Evidence Integrity
After the memory image was created, I calculated a SHA-256 hash of the file before beginning forensic analysis.
The following PowerShell command was used:
Get-FileHash "C:\Memory Capture\win11-memory.raw" -Algorithm SHA256
The resulting SHA-256 hash was:
93D4A3D8FF40B2FE7167044E8A4AE570DFC99EA1A217E8321A87508BAEC82F03
Hashing the memory image provides a way to verify that the evidence remains unchanged during the investigation. If the same file produces the same SHA-256 value later, it provides strong assurance that the contents of the image have not been modified.
It is important to distinguish this from proving what happened on the system. The hash does not explain user activity or system behavior; it only helps establish the integrity of the captured evidence.
Identifying the Memory Image with Volatility
After transferring the captured memory image to the Kali Linux analysis machine, the first step was to verify that Volatility could correctly interpret the image.
I used Volatility 3, a memory forensics framework designed to analyze RAM captures and recover system information, processes, network artifacts, command-line data, and other volatile evidence.
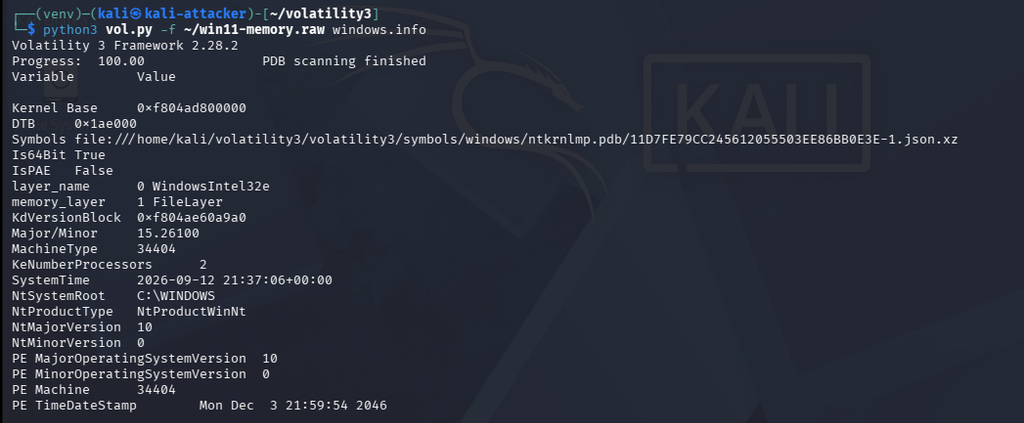
The following command was used:
python3 vol.py -f ~/win11-memory.raw windows.info
The windows.info plugin analyzes the memory image and retrieves basic operating system and kernel information.
In this case, Volatility successfully identified the image as a 64-bit Windows system and loaded the required Windows kernel symbols.
Important values recovered included:
Is64Bit: True
NtSystemRoot: C:\WINDOWS
NtMajorVersion: 10
NtMinorVersion: 0
Major/Minor: 15.26100
SystemTime: 2026-09-12 21:37:06 UTC
The build information corresponds to the Windows 11 environment used in the controlled lab.
This step is important because forensic analysis depends on correctly interpreting the structures stored in memory. If the framework cannot identify the operating system or load the appropriate symbols, later plugins may fail or produce unreliable results.
In Volatility 3, Windows symbols are used to understand internal kernel data structures. Once the correct symbols were loaded, the memory image could be examined using additional plugins such as process listings, command-line recovery, and network-state analysis.
Short Takeaway
Before investigating individual processes or user activity, the memory image first had to be successfully recognized by the forensic framework. The successful windows.info result confirmed that the image was suitable for further analysis.
Recovering Running Processes
After confirming that Volatility could correctly interpret the memory image, the next step was to examine which processes were active when the capture was taken.
For this, I used the windows.pslist plugin:
python3 vol.py -f ~/win11-memory.raw windows.pslist
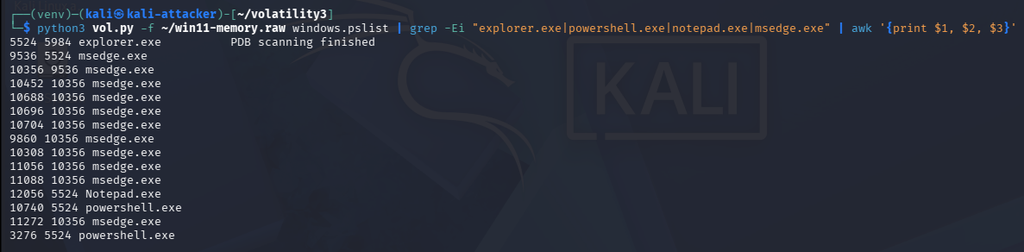
Because the full process list contained many normal Windows background processes, I filtered the output to focus on the applications that were part of the controlled activity scenario:
python3 vol.py -f ~/win11-memory.raw windows.pslist |
grep -Ei "explorer.exe|powershell.exe|notepad.exe|msedge.exe" |
awk '{print $1, $2, $3}'
The filtered output recovered the processes we expected to find, including:
5524 5984 explorer.exe
12056 5524 Notepad.exe
10740 5524 powershell.exe
3276 5524 powershell.exe
10356 9536 msedge.exe
This result is significant because it confirms that the applications used during the ground-truth scenario were still represented in memory.
The most useful detail is the parent process relationship.
Both Notepad.exe and the PowerShell processes have explorer.exe as their parent process:
explorer.exe
├── Notepad.exe
├── powershell.exe
└── powershell.exe
That is consistent with normal interactive user activity in Windows, where applications launched from the desktop or Start menu are commonly started through explorer.exe.
Microsoft Edge appears as several separate processes. This is expected because modern Chromium-based browsers use a multi-process architecture, where different browser functions can run in separate processes.
For example, separate processes may be created for:
- browser tabs
- rendering
- GPU functions
- network services
- extensions
- background components
The presence of multiple msedge.exe processes therefore does not indicate suspicious activity by itself.
The important forensic point is that memory analysis allowed the investigation to reconstruct which user applications were active at the moment of acquisition and how some of them were related to one another.
Investigation takeaway
The process list successfully matched the known ground-truth activity. Edge, Notepad, and PowerShell were all recovered from RAM, and the parent process information showed that Notepad and PowerShell were launched through explorer.exe, consistent with normal interactive use.
Recovering Process Command-Line Information
After identifying the relevant processes, the next step was to examine how those applications had been launched.
For this, I used Volatility’s windows.cmdline plugin:
python3 vol.py -f ~/win11-memory.raw windows.cmdline
Because the full output contained many entries, I filtered it using the process IDs already identified during the previous step:
python3 vol.py -f ~/win11-memory.raw windows.cmdline |
grep -E "^12056|^10740|^3276|^10356"
The recovered output showed command-line information for the main applications involved in the controlled scenario:
10356 msedge.exe "C:\Program Files (x86)\Microsoft\Edge\Application\msedge.exe" ...
12056 Notepad.exe "C:\Program Files\WindowsApps\Microsoft.WindowsNotepad_...\Notepad\Notepad.exe"
10740 powershell.exe "C:\Windows\System32\WindowsPowerShell\v1.0\powershell.exe"
3276 powershell.exe "C:\Windows\System32\WindowsPowerShell\v1.0\powershell.exe"
This result adds more context than a simple process list.
windows.pslist confirmed that these processes existed in memory, while windows.cmdline showed the executable paths associated with those processes.
The recovered paths were consistent with normal Windows application locations:
- Microsoft Edge was launched from its installed application directory.
- Notepad was launched from the Windows Apps package directory.
- PowerShell was launched from the standard Windows PowerShell directory.
This is useful because command-line and path information can help an investigator distinguish normal execution from unusual behavior.
For example, a process named powershell.exe running from:
C:\Windows\System32\WindowsPowerShell\v1.0\
is expected.
The same process name running from an unusual directory such as a temporary folder or user download directory could require closer investigation.
However, the executable path alone is not enough to determine whether a process is benign or malicious. It is only one piece of evidence that must be correlated with other artifacts.

Investigation takeaway
The command-line analysis confirmed not only that Edge, Notepad, and PowerShell were present in memory, but also where their executables were launched from. In this controlled scenario, the recovered paths were consistent with normal Windows application locations.
One important limitation also appeared here: the cmdline plugin recovered how PowerShell itself was launched, but it did not directly show the individual commands typed interactively inside the PowerShell session, such as whoami, ipconfig, and Get-Process.
Those commands required a different approach, which we examine later by searching for execution-related strings in the raw memory image.
Recovering Unsaved Text from Memory
One of the most interesting parts of the investigation was testing whether text that had never been saved to disk could still be recovered from RAM.
Before the memory image was captured, Notepad contained the unsaved text:
Test Memory InvestigationWindows
Because the text remained open in Notepad during acquisition, there was a reasonable chance that fragments of it might still exist in volatile memory.
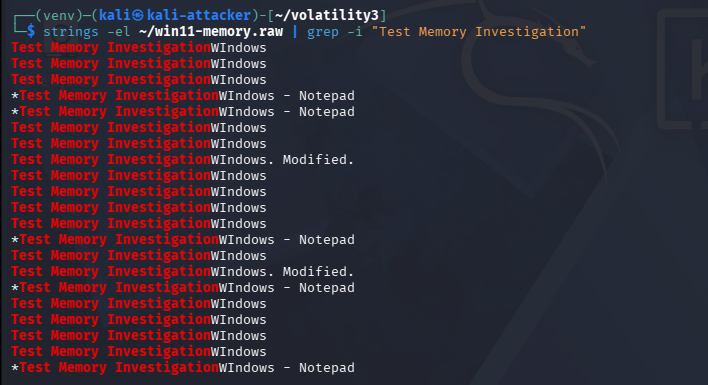
Windows applications commonly store text using UTF-16LE encoding, so I searched the raw memory image using the strings utility with Unicode support:
strings -el ~/win11-memory.raw | grep -i "Test Memory Investigation"
The search returned multiple matches containing the exact text entered in Notepad, including references such as:
Test Memory InvestigationWindows
and window-title-related strings containing:
*Test Memory InvestigationWindows - Notepad
This was especially significant because the Notepad document had not been saved as a normal file.
The text was recovered directly from the captured RAM image.
That demonstrates one of the key strengths of memory forensics: information that exists only temporarily while a system is running may still be recoverable even when no corresponding file exists on disk.
However, the presence of a string in memory should still be interpreted carefully. A recovered text fragment proves that the data existed somewhere in memory at the time of acquisition, but by itself it does not always explain exactly how the data was created or used.
In this controlled experiment, the interpretation is much stronger because the recovered text exactly matched the known ground-truth activity created before the capture.
Investigation takeaway
The unsaved Notepad text was successfully recovered from RAM even though it had never been written to a normal document file. This shows how volatile memory can preserve temporary user-created data that may disappear once the system is shut down.
Recovering Evidence of PowerShell Commands
After recovering the PowerShell processes themselves, the next question was whether the memory image contained evidence of the commands that had been executed during the controlled scenario.
Before acquisition, I had intentionally run:
whoami
ipconfig
Get-Process
The windows.cmdline plugin did not directly show these interactive commands, so I searched the raw memory image for related strings instead.
Because Windows frequently stores text in UTF-16LE format, I used:
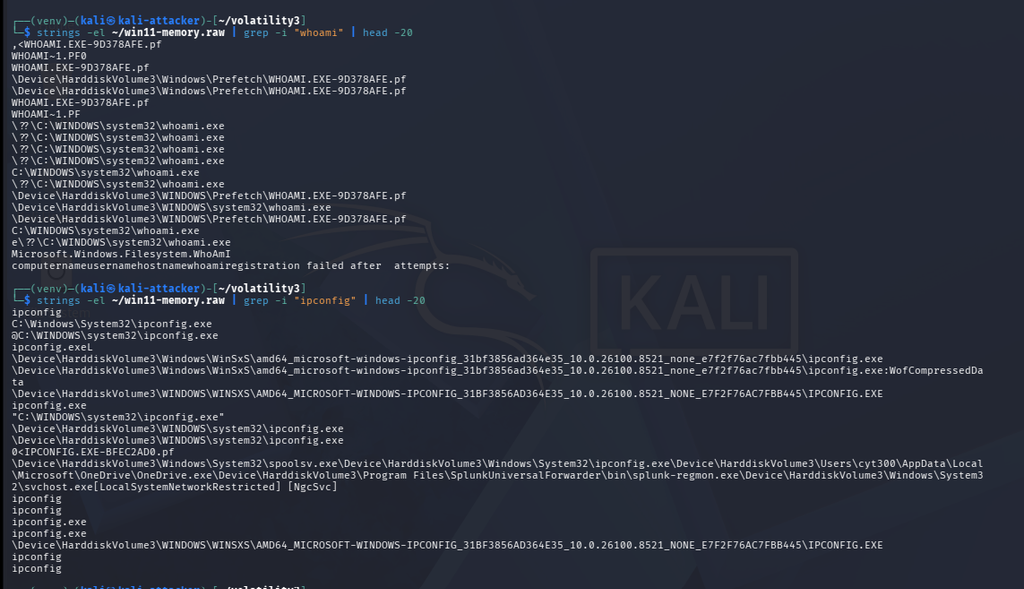
strings -el ~/win11-memory.raw | grep -i "whoami" | head -20strings -el ~/win11-memory.raw | grep -i "ipconfig" | head -20
The results contained multiple references to the corresponding Windows executables, including:
C:\WINDOWS\system32\whoami.exe
C:\WINDOWS\system32\ipconfig.exe
The memory image also contained references to Windows Prefetch artifacts associated with these programs.
These findings are consistent with the fact that both utilities had been executed shortly before the RAM capture.
However, this evidence must be interpreted carefully.
Finding whoami.exe or ipconfig.exe in memory is not exactly the same as recovering the original command as typed by the user. It shows that execution-related artifacts associated with those programs were present in RAM.
That makes them useful supporting evidence, especially because they match the known ground truth of the experiment.
Recovering Evidence of Get-Process
I then searched for evidence related to the third PowerShell command:
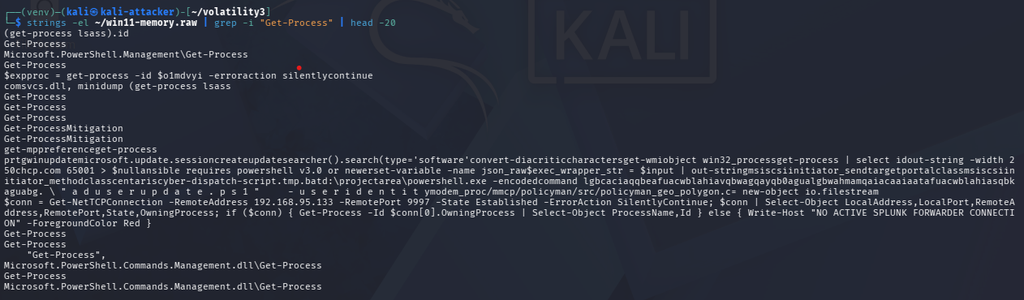
strings -el ~/win11-memory.raw | grep -i "Get-Process" | head -20
The search also returned references to Get-Process within the memory image.
Unlike whoami and ipconfig, Get-Process is a PowerShell cmdlet rather than a standalone executable, so the type of evidence recovered is different.
This distinction is useful because memory analysis may preserve different kinds of artifacts depending on how a command is implemented and executed.
Investigation takeaway
The memory image contained execution-related evidence corresponding to all three commands used during the experiment. However, these artifacts should be treated as supporting evidence rather than definitive proof of the exact command line entered by the user.
The stronger conclusion comes from correlation:
- PowerShell processes were recovered.
- The known PowerShell activity was visible before acquisition.
- Memory contained artifacts associated with whoami, ipconfig, and Get-Process.
Together, those findings support the reconstruction of the controlled PowerShell activity.
Recovering Network State from Memory
After examining processes and user activity, the next step was to determine whether the memory image contained evidence of network activity.
Because Microsoft Edge was open and had successfully accessed a website before acquisition, I expected that some network-related state might still be present in RAM.
I first tried Volatility’s windows.netscan plugin:
python3 vol.py -f ~/win11-memory.raw windows.netscan
In this particular capture, windows.netscan did not return useful socket records.
That does not necessarily mean that no network activity existed. Memory artifacts are highly dependent on timing, operating system structures, and what remains recoverable at the moment of acquisition.
To compare results, I then used:
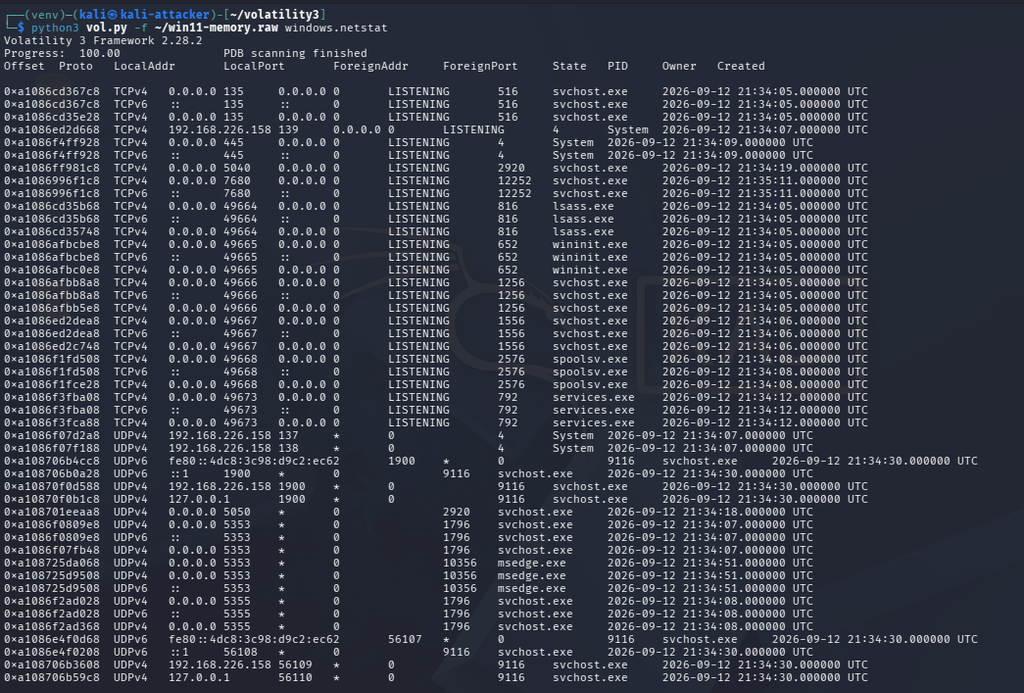
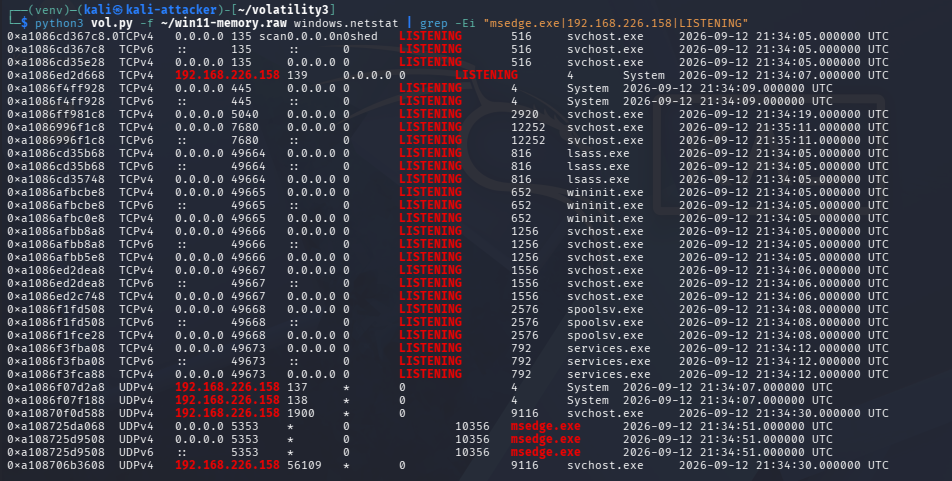
python3 vol.py -f ~/win11-memory.raw windows.netstat
This plugin successfully recovered network-related information from the memory image.
The output included:
- the Windows VM address 192.168.226.158
- several listening services
- TCP and UDP entries
- network-related entries associated with msedge.exe
- system processes bound to local ports
Because the complete output was large, I filtered it to focus on the most relevant entries:
python3 vol.py -f ~/win11-memory.raw windows.netstat |
grep -Ei "msedge.exe|192.168.226.158|LISTENING"
This produced a much clearer view of the network state relevant to the investigation.
One useful finding was the presence of entries associated with the Microsoft Edge process. Since Edge had been used to access Google before the memory capture, these artifacts were consistent with the known activity performed on the target system.
However, the network output should still be interpreted carefully.
A recovered socket or network endpoint can show that a process had network-related state in memory, but by itself it may not prove exactly which webpage was visited or what data was exchanged.
The strongest interpretation comes from correlation with other evidence:
- Edge was visible in the ground-truth screenshot
- msedge.exe processes were recovered with pslist
- command-line information confirmed Edge was running
- windows.netstat recovered network-related entries associated with Edge
Together, those artifacts support the conclusion that browser network activity was present when the memory image was captured.
An Important Forensic Lesson
One of the more interesting results was the difference between the two network plugins.
windows.netscan did not provide useful results from this image, while windows.netstat successfully recovered network state.
That illustrates an important principle in digital forensics:
A single tool or plugin should not be treated as the only source of truth.
Different analysis techniques may recover different artifacts from the same memory image. If one method produces no result, an investigator should not immediately conclude that the evidence never existed.
Instead, findings should be compared across multiple sources and interpreted in context.
Investigation takeaway
The memory image preserved network-related state associated with Microsoft Edge and several Windows services. Although the initial netscan attempt did not recover useful sockets, netstat did, demonstrating both the value and the limitations of memory-based network analysis.
Correlating the Evidence
Up to this point, each artifact was examined separately: processes, command-line information, unsaved text, PowerShell-related strings, and network state.
The most important step in a forensic investigation is bringing those artifacts together.
A single artifact rarely tells the complete story. Instead, confidence comes from correlation, comparing multiple pieces of evidence and checking whether they support the same sequence of events.
In this experiment, the known ground truth was:
- Microsoft Edge was opened
- A website was accessed
- PowerShell was launched
- whoami was executed
- ipconfig was executed
- Get-Process was executed
- Notepad was opened
- Unsaved text was entered
- The system memory was captured
The memory image preserved evidence corresponding to nearly every part of that activity.
Evidence Correlation
| Known Activity | Recovered Evidence | Interpretation |
| Edge was opened | msedge.exe processes in pslist | Confirms Microsoft Edge was running |
| Browser network activity occurred | Edge-related entries in windows.netstat | Supports the presence of browser network activity |
| PowerShell was launched | powershell.exe processes recovered | Confirms PowerShell was active |
| PowerShell launched interactively | powershell.exe parented by explorer.exe | Consistent with normal user-launched PowerShell activity |
| whoami executed | whoami.exe execution-related strings | Supports execution of the command |
| ipconfig executed | ipconfig.exe execution-related strings | Supports execution of the command |
| Get-Process executed | Get-Process references recovered from memory | Supports PowerShell cmdlet activity |
| Notepad was opened | Notepad.exe recovered in pslist | Confirms Notepad was active |
| Unsaved text was entered | Exact text recovered from RAM | Strong evidence of temporary user-created data |
| Windows system captured | windows.info successfully identified the image | Confirms the memory image was valid and analyzable |
The most important point is that these findings reinforce each other.
For example, the presence of powershell.exe alone would only prove that PowerShell was running. It would not show what happened inside the session.
However, when that finding is combined with:
powershell.exe recovered
+
explorer.exe parent relationship
+
whoami.exe artifacts
+
ipconfig.exe artifacts
+
Get-Process references
the overall reconstruction becomes much stronger.
The same applies to the Notepad evidence.
Notepad.exe being present only tells us that the application was running. The recovery of the exact unsaved phrase:
Test Memory InvestigationWindows
provides a much stronger connection between the running process and the user activity that occurred before acquisition.
Reconstructing the Activity
Based on the combined evidence, the system activity can be reconstructed approximately as:
User interacting with Windows
↓
explorer.exe active
↓
Microsoft Edge opened
↓
Browser network activity occurred
↓
PowerShell launched
↓
whoami / ipconfig / Get-Process activity
↓
Notepad opened
↓
Unsaved text entered
↓
RAM captured with WinPmem
This sequence closely matches the activity intentionally performed before the memory acquisition.
That agreement between known ground truth and recovered forensic artifacts demonstrates how memory analysis can be used to reconstruct system activity from multiple independent sources.
What the Evidence Does Not Prove
Correlation also requires knowing where the limits are.
For example:
- A reference to whoami.exe does not by itself prove the exact text the user typed.
- A network socket associated with Edge does not prove which webpage was viewed.
- A process being present does not make it suspicious.
- A string recovered from RAM does not always explain how or why it was created.
Forensic conclusions should therefore be based on the combined weight of the evidence rather than a single artifact.
Investigation Takeaway
The strongest conclusions in memory forensics come from correlation. Processes, command-line data, network state, and recovered strings each provide only part of the picture. When those artifacts agree with one another, they can be combined to reconstruct a much more reliable explanation of what was happening on the system.
What Memory Forensics Could and Could Not Recover
This experiment showed that a memory image can preserve a surprising amount of useful evidence, but it also demonstrated that RAM analysis has clear limitations.
Some artifacts were recovered very cleanly, while others were incomplete or required several different techniques before useful evidence appeared.
What Was Successfully Recovered
The strongest recovered artifacts were:
- Running processes – Volatility identified Microsoft Edge, Notepad, PowerShell, and Explorer.
- Parent-child process relationships – Notepad and PowerShell were shown as children of explorer.exe, which matched the known interactive user activity.
- Executable command-line paths – windows.cmdline recovered the application paths for Edge, Notepad, and PowerShell.
- Unsaved Notepad text – the exact phrase entered before acquisition was recovered directly from RAM.
- Execution-related traces for whoami and ipconfig – memory contained executable paths and related artifacts consistent with those commands being run.
- References to Get-Process – the PowerShell cmdlet was also visible in memory strings.
- Network state – windows.netstat recovered listening services and entries associated with msedge.exe.
What Was Not Recovered Cleanly
Not every expected artifact was available in a straightforward form.
For example, windows.cmdline showed how PowerShell itself had been launched, but it did not directly reconstruct the exact interactive sequence:
whoami
ipconfig
Get-Process
Instead, evidence of those commands had to be found separately through memory-string analysis.
Likewise, network analysis produced mixed results.
The initial command:
python3 vol.py -f ~/win11-memory.raw windows.netscan
did not return useful socket information from this image.
However, the alternative:
python3 vol.py -f ~/win11-memory.raw windows.netstat
did recover useful network state, including listening ports and entries associated with Microsoft Edge.
That difference is important.
A failure to recover something with one plugin does not automatically mean that the evidence never existed.
Why netstat Was Useful Here
In this investigation, windows.netstat provided the clearer network view.
It recovered information such as:
192.168.226.158
LISTENING
msedge.exe
along with other TCP and UDP entries.
This did not prove exactly which webpage Edge had visited, but it supported the known ground-truth observation that Edge was active and using the network before memory acquisition.
The finding became more useful when correlated with:
msedge.exe recovered with pslist
+
Edge command-line information
+
network entries associated with msedge.exe
Together, those artifacts support the conclusion that browser network activity was present.
What RAM Could Not Prove by Itself
The investigation also highlighted several important limits.
A memory artifact should not automatically be treated as proof of intent or meaning.
For example:
- A powershell.exe process does not prove malicious activity.
- A string containing whoami.exe does not prove exactly how or why it was executed.
- A network connection does not prove what content was transferred.
- A reference to a domain or application does not always prove the exact user action.
- A process path that looks normal does not guarantee that the process itself was trustworthy.
Memory forensics provides evidence, but interpretation still requires context and correlation.
Timing Matters
RAM is constantly changing.
Processes start and stop, buffers are reused, network structures disappear, and data can be overwritten within seconds.
That means the exact same activity performed again could produce a slightly different memory image.
In this experiment, the unsaved Notepad text survived clearly in memory, while some network evidence was less straightforward.
That difference demonstrates why memory acquisition should usually happen as soon as practical when volatile evidence matters.
Investigation Takeaway
Memory forensics can recover processes, temporary text, execution traces, and network state that may never appear clearly on disk. But RAM is incomplete and time-sensitive. The absence of one artifact does not necessarily prove that an activity never occurred, and no single recovered artifact should be interpreted without context.
Reconstructing the Investigation Timeline
After examining the recovered processes, command-line information, memory strings, and network state, the final step was to place the evidence into a logical sequence.
Because this was a controlled experiment, the original activity was already known. The purpose of the timeline was to compare that known sequence with what could actually be reconstructed from RAM.
Known Activity Sequence
Before memory acquisition, the following actions were intentionally performed on the Windows VM:
- Windows desktop was active
- Microsoft Edge was opened
- A website was accessed
- PowerShell was launched
- whoami was executed
- ipconfig was executed
- Get-Process was executed
- Notepad was opened
- Unsaved text was entered
- RAM was captured with WinPmem
The forensic evidence recovered from memory supported most of this sequence.
Reconstructed Timeline
A reasonable reconstruction based on the recovered artifacts is:
Windows user session active
↓
explorer.exe running
↓
Microsoft Edge launched
↓
Browser-related network activity present
↓
PowerShell launched from explorer.exe
↓
Execution-related artifacts for whoami and ipconfig recovered
↓
References to Get-Process recovered
↓
Notepad launched from explorer.exe
↓
Unsaved text present in memory
↓
System memory captured with WinPmem
This reconstruction closely matches the known ground truth.
The process evidence showed that explorer.exe was active and that both powershell.exe and Notepad.exe appeared as child processes, which is consistent with normal interactive use.
The recovered command-line information confirmed the executable paths for PowerShell, Notepad, and Microsoft Edge.
String analysis then added more detailed evidence. References associated with whoami.exe, ipconfig.exe, and Get-Process matched the commands intentionally executed before acquisition.
The strongest user-activity artifact was the recovery of the exact unsaved Notepad text:
Test Memory InvestigationWindows
This provided direct evidence that temporary user-created content still existed in RAM at the time of acquisition.
Finally, windows.netstat recovered network-related state associated with Microsoft Edge, which supported the fact that browser activity had occurred before the memory image was captured.
Timeline Confidence
Not every part of the sequence was recovered with the same level of confidence.
Some artifacts were very strong:
- powershell.exe and Notepad.exe were clearly present
- parent process relationships were visible
- the unsaved Notepad text was recovered exactly
- execution-related traces matched the commands used during the scenario
Other findings were more indirect:
- network artifacts supported browser activity but did not identify the exact webpage
- string matches for commands did not fully reconstruct the exact interactive PowerShell history
- some network information was only recoverable with windows.netstat, not windows.netscan
This is normal in memory forensics.
A forensic timeline is not simply a list of recovered strings. It is an interpretation built from multiple artifacts, with each finding given an appropriate level of confidence.
Investigation Takeaway
The reconstructed timeline closely matched the activity that had been intentionally created before memory acquisition. The strongest result was not any single Volatility command, but the way independent artifacts supported the same overall sequence of events.
Conclusion – What This Investigation Demonstrated
This investigation showed that a memory image can preserve a surprisingly detailed snapshot of what was happening on a Windows system at a specific moment in time.
Using a controlled Windows 11 lab, I intentionally created a small sequence of activity involving Microsoft Edge, PowerShell, and Notepad. The system’s RAM was then captured with WinPmem and analyzed from Kali Linux using Volatility 3.
The investigation successfully recovered several different kinds of evidence:
- active user processes such as msedge.exe, powershell.exe, and Notepad.exe
- parent-child process relationships
- executable command-line paths
- execution-related artifacts associated with whoami, ipconfig, and Get-Process
- network-related state associated with Microsoft Edge
- and, most notably, the exact unsaved text that had been entered into Notepad
The recovery of the unsaved Notepad text was one of the clearest demonstrations of why volatile memory matters in digital forensics. That information existed in RAM even though it had not been saved as a normal file.
At the same time, the investigation also showed the limitations of memory analysis.
Not every artifact was recovered cleanly. The exact interactive PowerShell history was not reconstructed directly by windows.cmdline, and windows.netscan did not provide useful socket information from this image. Other techniques, such as raw string analysis and windows.netstat, were needed to recover supporting evidence.
That leads to one of the most important lessons from the experiment:
Memory forensics is not about finding one perfect artifact. It is about combining multiple pieces of volatile evidence and determining whether they support the same explanation of what happened.
Processes, command-line data, network state, and recovered strings each provided only part of the picture. When those artifacts were correlated, however, the reconstructed activity closely matched the known ground truth created before acquisition.
This experiment also reinforces another important principle: the absence of one artifact does not necessarily prove that an activity never occurred. RAM changes constantly, and evidence can disappear, move, or become overwritten as the system continues running.
For that reason, memory acquisition is often most valuable when performed as early as practical and when its results are interpreted alongside other evidence sources rather than in isolation.
For a broader defensive-security lab involving threat intelligence, detection, Splunk, MISP, and TheHive, see my Threat-Intelligence-Driven Detection Lab
Overall, this lab demonstrated how memory forensics can reveal temporary system and user activity that may not be available through disk analysis alone. It also showed why careful interpretation, correlation, and evidence integrity are essential when turning raw memory artifacts into a defensible forensic conclusion.
Final takeaway
RAM is temporary, but while a system is running, it can contain valuable evidence about processes, commands, network activity, and even unsaved user data. The real power of memory forensics comes from correlating those artifacts into a coherent explanation of system activity.
If this piece gave you something to think about, you can support my writing here ☕