
On this page
Build the virtual environment, configure private networking, install MISP and Splunk, and begin collecting Windows endpoint telemetry.
Requirements & Prerequisites
Before building the lab, make sure your system has enough resources and that you are comfortable with basic networking, Linux, and security-monitoring concepts.
Hardware Requirements
Because several virtual machines may run at the same time, the host system should have enough memory and storage to keep the lab stable.
Recommended:
- 16 GB RAM minimum; more is helpful when running all services together.
- 4-core or better processor with hardware virtualization enabled.
- 80–120 GB of free storage for virtual machines, logs, snapshots, and supporting files.
- A stable internet connection for downloading tools, updates, and enrichment data.
If your system has limited resources, you can run fewer virtual machines at the same time and start only the components needed for each stage.
Software and Platforms
The lab will use:
- VMware Workstation for virtualization.
- Linux virtual machines for the security platforms and supporting services.
- Splunk for log collection, monitoring, and detection.
- MISP for threat-intelligence management.
- TheHive for alert and investigation management.
- A threat-intelligence or file-enrichment service for observable lookups.
- Python for automation and API integration.
- MITRE ATT&CK as the reference framework for adversary behaviour.
Specific software versions, operating systems, and the selected enrichment service will be identified in the relevant setup sections so readers can reproduce the lab with the same configuration.
Networking
The virtual machines should communicate through a private lab network separated from production systems.
Each system should use a predictable IP address so the different components can communicate reliably through APIs and service ports.
Internet access may be enabled where required for software installation, updates, or external enrichment queries while keeping the lab logically separated from personal or production devices.
Knowledge Prerequisites
You do not need advanced SOC experience to follow this project, but familiarity with the following will help:
- Basic Linux command-line usage.
- IP addressing and private networking.
- Virtual machines and snapshots.
- Basic log and event concepts.
- HTTP and REST APIs.
- JSON data.
- Basic Python programming.
- Indicators of compromise such as hashes, IP addresses, and domains.
- General SIEM and threat-intelligence concepts.
The integration process will be explained as the lab is built, so prior experience with every platform is not required.
Accounts and API Access
Some stages of the project require API credentials or platform access.
Before beginning the integration and automation sections, you may need:
- an API key for the selected enrichment service;
- API access to MISP;
- API access to TheHive;
- and the Splunk authentication method required by the integration implemented later in the project.
The exact authentication method, endpoints, and configuration details will be documented in the relevant setup sections.
Store all credentials securely and never hard-code real secrets into code that will be published or committed to a public repository.
Recommended Lab Practice
Take a virtual-machine snapshot after each major component is successfully installed and configured. This creates a clean recovery point if a later integration or configuration change breaks part of the environment.
Environment Setup
Before installing the security tools, we first need to build a stable lab environment where every component can communicate while remaining separated from the rest of the network.
For this project, we will use five virtual machines connected through a private lab network.
1. Lab Environment
The planned environment is:
|
VM |
Operating System |
Role |
Lab IP |
|
Endpoint-01 |
Windows 11 |
Monitored endpoint/test activity |
192.168.95.134 |
|
Splunk-01 |
Ubuntu Server 24.04 LTS |
SIEM + automation scripts |
192.168.95.133 |
|
MISP-01 |
Ubuntu Server 24.04 LTS |
Threat-intelligence platform |
192.168.95.131 |
|
TheHive-01 |
Ubuntu Server 24.04 LTS |
Investigation and case management |
192.168.95.132 |
|
Kali |
Kali Linux |
controlled remote test system |
192.168.95.135 |
Ubuntu 24.04 LTS provides a useful common platform for the Linux side of the lab. It is currently supported by Splunk Enterprise and TheHive, while MISP 2.5 specifically recommends Ubuntu 24.04 for installation.
The Windows endpoint will later provide the security telemetry that begins the detection workflow.
2. Software Versions
- For this build, the environment will target:
- Windows 11: monitored endpoint
- Ubuntu Server 24.04 LTS: Linux servers
- Splunk Enterprise 10.4: SIEM
- MISP 2.5: threat-intelligence management
- TheHive 5: investigation platform
- VirusTotal API v3: file-hash enrichment
- Python 3: automation and API integration
- MITRE ATT&CK: behavioural mapping reference
Splunk Enterprise 10.4 is part of the current 10.x release line as of this build.
VirusTotal API v3 will be used later to enrich file hashes. Its API can retrieve file information using MD5, SHA-1, or SHA-256 hashes, and a Community account provides an API key suitable for simple API lookups.
Version note: Security tools change frequently. Record the exact version you install while following the project so you can troubleshoot differences if the software changes later.
3. Configure the Lab Network
Create a private virtual network for communication between the machines.
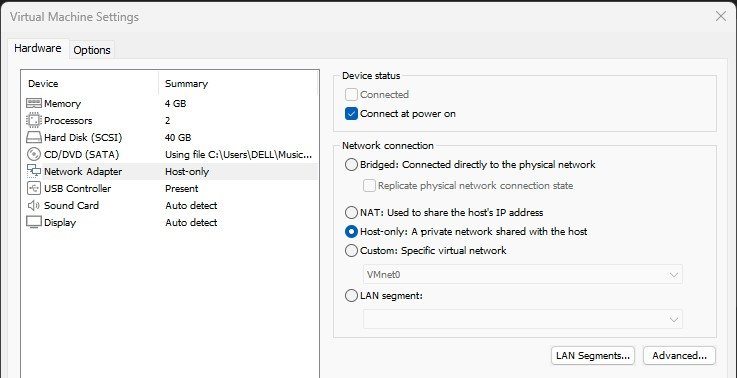
Figure 2. VMware network adapter configured in Host-only mode for private lab communication.
For this project:
Network:
- Endpoint-01: 192.168.95.134
- Splunk-01: 192.168.95.133
- MISP-01: 192.168.95.131
- TheHive-01: 192.168.95.132
A useful configuration is to give each VM:
- one private/host-only adapter for communication inside the lab;
- and, where required, a NAT adapter for software downloads, updates, and external API requests.
Do not configure inbound port forwarding from your physical network into the lab.
All integration traffic between Splunk, MISP, and TheHive should use their private lab IP addresses.
4. Create the Virtual Machines
Create each VM before installing the security platforms.
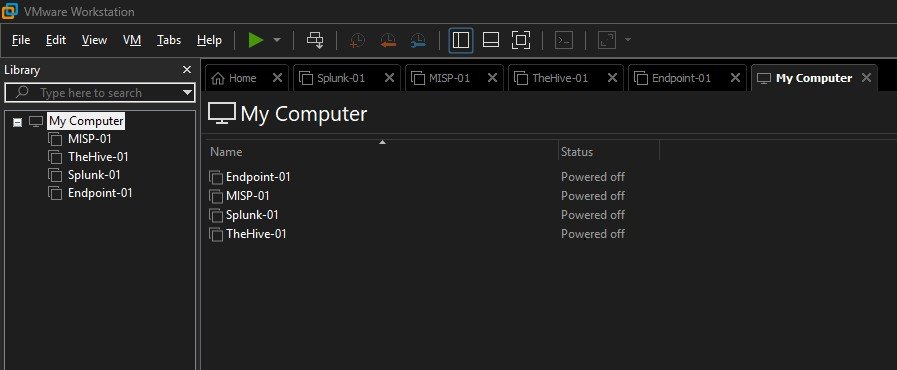
Figure 3. Virtual machines created for the threat-detection lab in VMware Workstation.
Suggested starting allocations for a learning environment are:
|
VM |
vCPU |
RAM |
Storage |
|
Endpoint-01 |
2 |
4 GB |
40 GB |
|
Splunk-01 |
2 – 4 |
4 GB |
40 – 60 GB |
|
MISP-01 |
2 |
4 GB |
40 GB |
|
TheHive-01 |
2 – 4 |
6 GB |
50 – 60 GB |
|
Kali |
2 |
4 GB |
40 GB |
These are lab allocations, not production sizing recommendations.
TheHive’s own demonstration VM recommends at least 6 GB of RAM for stable performance, which is why it receives more memory than the other lab servers.
If your host has limited memory, build and configure the systems in stages rather than running every VM continuously. For a smoother full-pipeline test, additional host memory is helpful.
5. Prepare the Linux Server
After installing Ubuntu Server on Splunk-01, MISP-01, and TheHive-01, update each system:
sudo apt update
sudo apt upgrade -y
Assign each machine its hostname:
splunk-01
misp-01
thehive-01
Make sure all systems use consistent time settings. Accurate timestamps are important because security events will later be correlated across multiple platforms.
Before installing any application, confirm that each Linux VM:
- has its assigned private IP;
- can reach the other lab machines;
- has internet access when required;
- has current system updates;
- and uses a unique hostname.
6. Prepare the Windows Endpoint
Create the Windows 11 VM and assign:
Hostname: ENDPOINT-01
Lab IP: 192.168.95.134
This machine will eventually generate the security event used to test the complete pipeline.
Later in the project, we will configure the Splunk Universal Forwarder to send Windows Security, System, and Firewall telemetry from Endpoint-01 to the Splunk server.
The Windows Firewall log will provide the network activity used by the final detection, while the Security and System logs provide additional endpoint context.
Do not introduce the EICAR test artifact yet. First make sure the monitoring and detection pipeline is working.
7. Verify Network Connectivity
Once all systems have their private addresses, confirm that they can communicate.
From one of the Linux machines, for example:
ping 192.168.95.131
ping 192.168.95.132
From the Windows endpoint:
ping 192.168.95.133
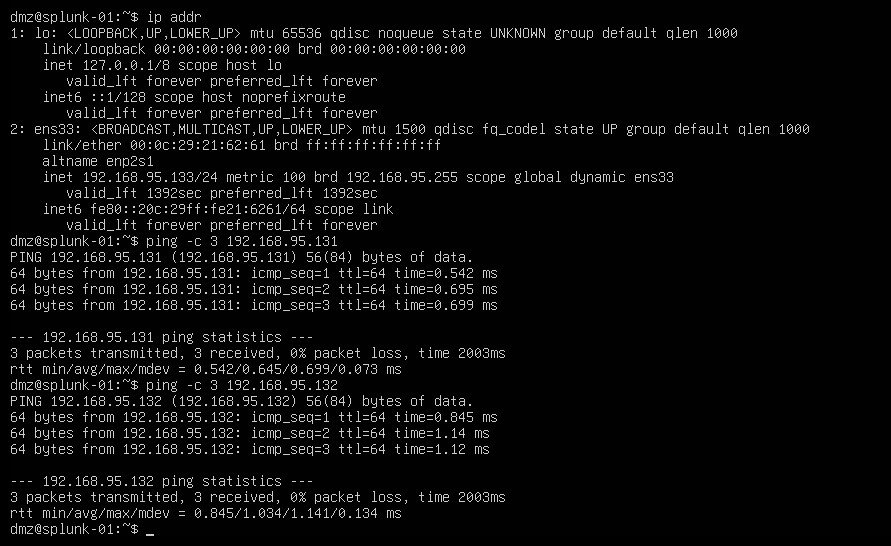
Figure 4. Verifying Splunk-01 network configuration and connectivity with MISP-01 and TheHive-01.
Successful connectivity at this stage prevents basic networking problems from being confused with API or application problems later.
We will test individual application ports only after each service has been installed.
8. Create a Baseline Snapshot
Before installing Splunk, MISP, or TheHive, shut down each VM and create a snapshot such as:
00-Clean-Baseline
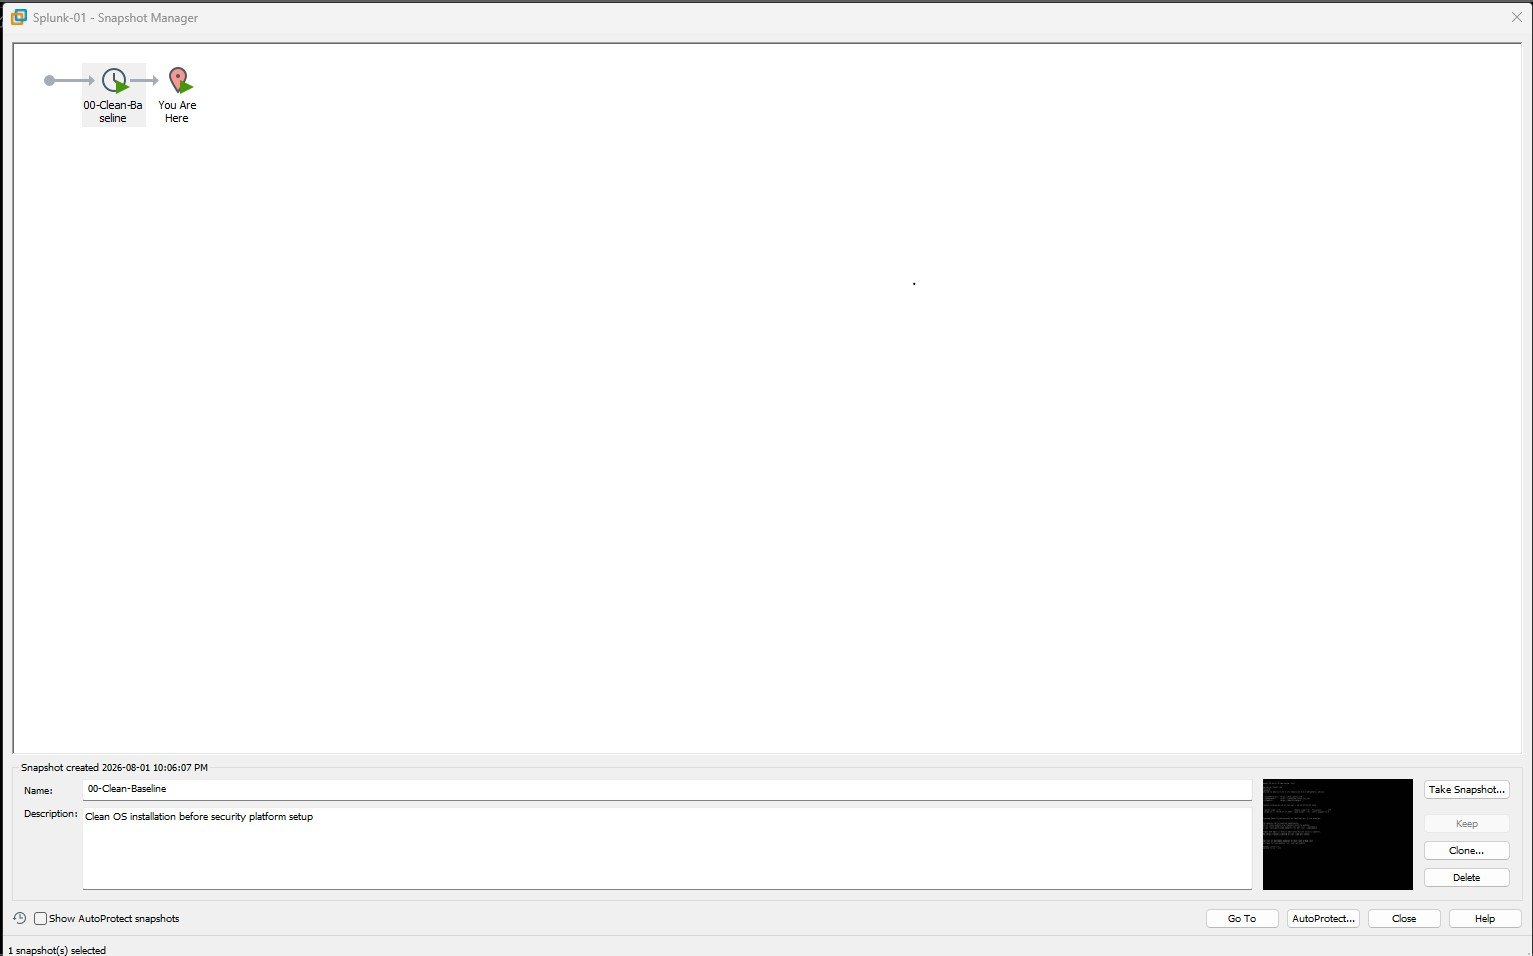
Figure 5. Clean baseline snapshot created for Splunk-01 before security platform configuration.
This gives you a clean recovery point if an installation fails or a later configuration causes problems.
Additional snapshots can be created after major milestones:
- 00-Clean-Baseline
- 01-Platform-Installed
- 02-Network-Verified
- 03-Integration-Working
- 04-Final-Pipeline
Keeping these recovery points makes experimentation much safer and avoids rebuilding the entire lab when something breaks.
9. Environment Checkpoint
Before moving forward, you should now have:
- five virtual machines created;
- a private 192.168.95.0/24 lab network;
- predictable IP addresses;
- updated operating systems;
- working communication between the machines;
- internet access where required;
- and clean baseline snapshots.
At this point, the infrastructure is ready. The next stage is to begin installing and configuring the individual security platforms.
MISP Setup
MISP provides the threat-intelligence layer of this lab. It is used to organize indicators and supporting context so that detections generated in Splunk can later be correlated with threat intelligence.
For this environment:
Hostname: misp-01
Lab IP: 192.168.95.131
OS: Ubuntu Server 24.04 LTS
Platform: MISP 2.5
The MISP project recommends Ubuntu 24.04 for new MISP 2.5 installations and provides an official installer specifically for this environment.
1. Verify the MISP Server
Before installing MISP, confirm that you are working on the correct VM:
hostnamectl
ip addr
Verify that the system identifies itself as misp-01, is running Ubuntu 24.04 LTS, and has the expected private lab address:
192.168.95.131
Also confirm that the server can reach the internet before starting the installation.
For example:
ping -c 3 192.168.95.133
This tests communication with the Splunk server.
2. Update Ubuntu
Update the package information and installed software:
sudo apt update
sudo apt upgrade -y
Reboot if the system installs updates that require it:
sudo reboot
Once the system returns, verify that the network configuration is still correct.
3. Download the Official MISP Installer
Download the Ubuntu 24.04 installer directly from the official MISP GitHub repository:
wget --no-cache -O /tmp/INSTALL.sh https://raw.githubusercontent.com/MISP/MISP/refs/heads/2.5/INSTALL/INSTALL.ubuntu2404.sh
The installer is designed for a fresh Ubuntu 24.04 system and installs MISP together with its required components and dependencies.
4. Run the Installer
Start the automated installation:
sudo bash /tmp/INSTALL.sh
Record the initial login credentials. When the installation completes, the installer displays the administrator username and generated password. Save these securely before closing the terminal. You will use them for the first login to MISP. Do not include the password in screenshots or documentation.
Allow the installer to complete.
Depending on the VM resources and internet connection, installation may take some time.
Do not manually configure individual MISP dependencies unless the installer reports a problem. For this lab, the automated installer handles the platform setup.
5. Verify That MISP is Reachable
After installation, verify the MISP web service from the Kali VM:
Kali IP: 192.168.95.135
MISP IP: 192.168.95.131
Run:
nmap -Pn -p 80,443 192.168.95.131
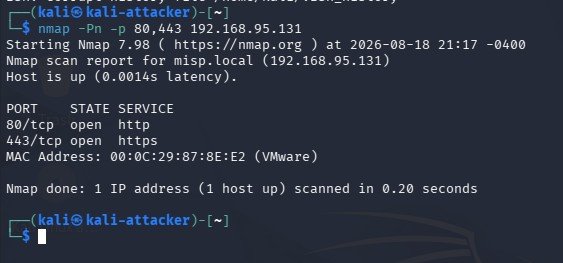
Figure 6. Verifying MISP web-service availability from the Kali VM on the private lab network.
The important result is that the MISP web service is now reachable.
In this lab:
80/tcp → HTTP / redirect
443/tcp → HTTPS
MISP is accessed through HTTPS in the completed environment.
6. Open the MISP Web Interface
From a browser connected to the lab network, open:
https://192.168.95.131
You can also use:
https://misp.local
if local name resolution has been configured. Both addresses can be used in this lab when local name resolution is configured.
Because this is an isolated lab using a self-signed certificate, your browser may display a certificate warning.
Confirm that the address belongs to your MISP VM before continuing.
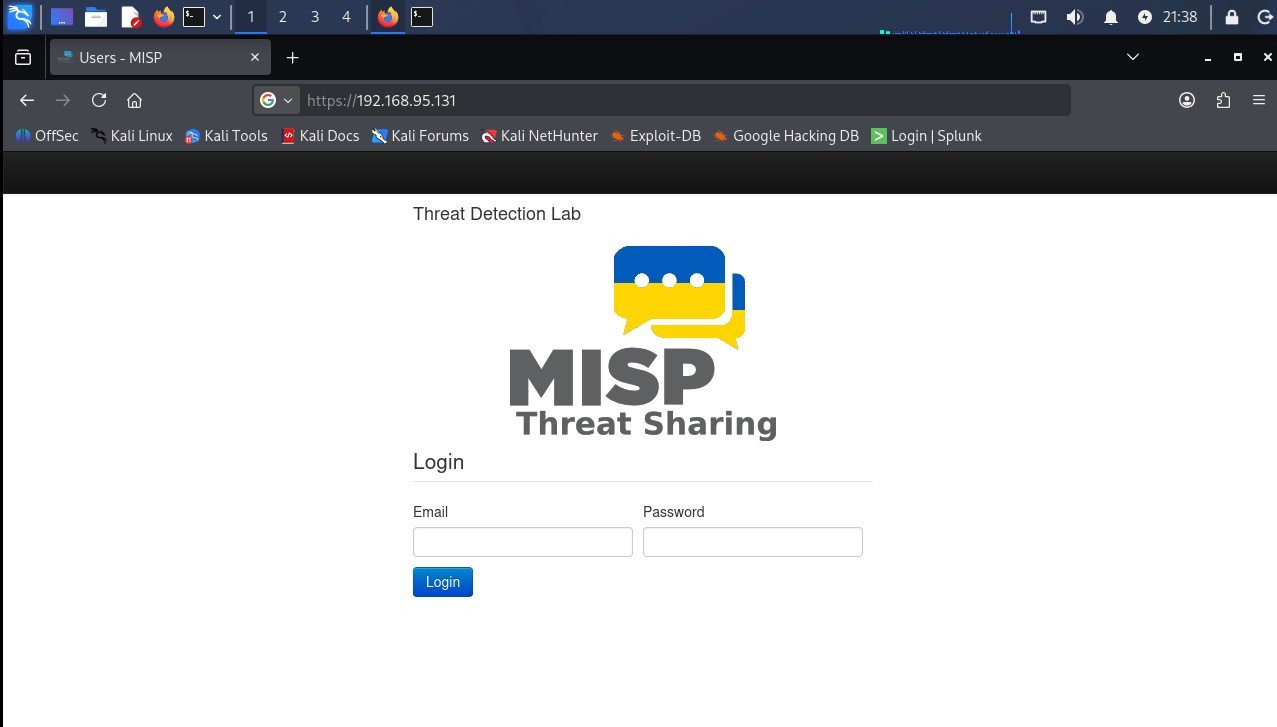
Figure 7. MISP web interface successfully accessible over HTTPS at 192.168.95.131.
Sign in using the administrator credentials generated during installation.
Do not include usernames, passwords, authentication keys, cookies, or other secrets in screenshots.
7. Explore the MISP Structure
Before integrating MISP with Splunk, become familiar with the parts of MISP that the pipeline will use.
Events: An event acts as a container for threat-intelligence information related to a detection or activity.
Attributes: Attributes are individual pieces of information stored inside an event.
Examples include:
- IP address
- Domain
- URL
- Filename
- File hash
- Port
Tags: Tags provide additional classification and context that can be associated with an event.
For this project, the important relationship is:
MISP Event
↓
Attributes
↓
Indicators and Context
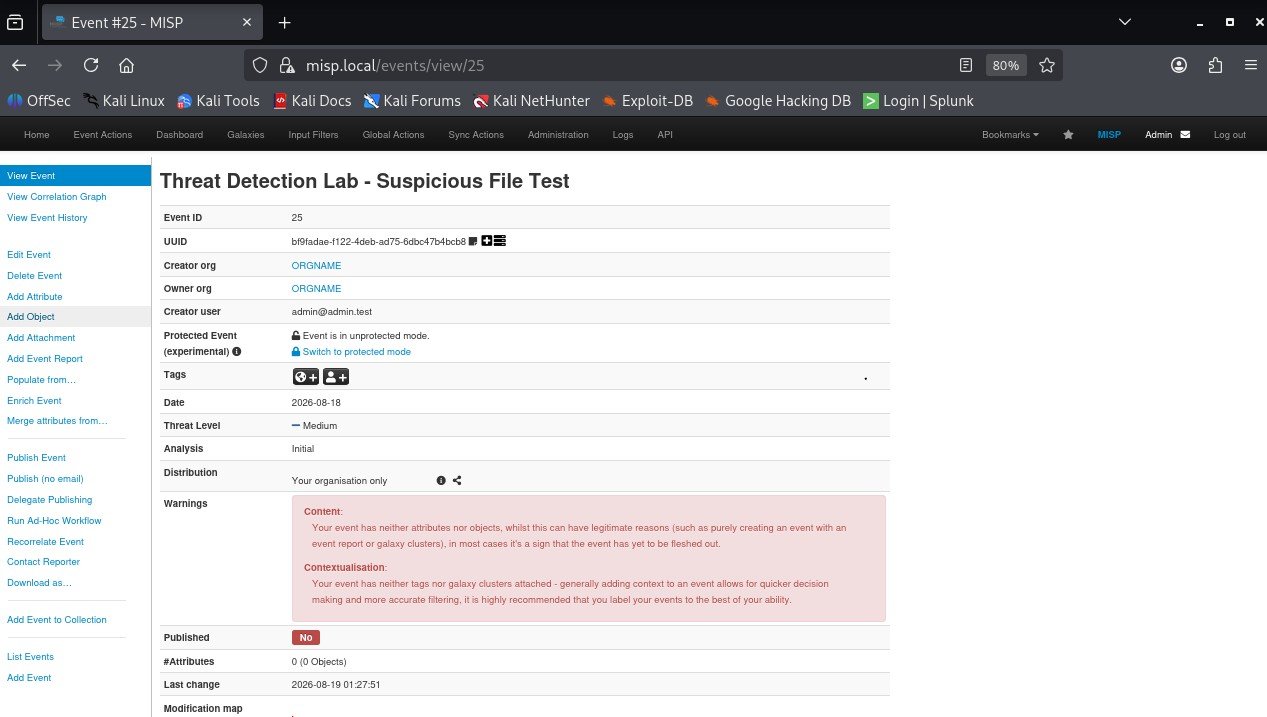
Figure 8. Initial MISP event created for the suspicious-file detection lab before indicators are added.
You do not need to configure every feature available in MISP before continuing.
8. Create an API Authentication Key
The automation script running on the Splunk server will later communicate with MISP through its API.
In MISP, create an authentication key for the account that will be used by the automation.
The API connection will originate from:
Splunk-01
192.168.95.133
Treat the MISP authentication key like a password.
Do not:
- place the real key inside screenshots;
- write it directly into public source code;
- publish it in the project guide;
- or commit it to a public Git repository.
This lab stores API credentials separately from the automation script in a protected secrets configuration.
We will configure that part when we build the Automation & Response Script.
9. Test MISP Before Integration
Before connecting MISP to Splunk or TheHive, confirm that:
- 192.168.95.131 responds on the lab network;
- the MISP web interface loads over HTTPS;
- you can successfully sign in;
- events and attributes can be viewed;
- and an API authentication key has been created for later use.
At this stage, do not worry about automatically creating events yet.
That logic will be added later when the detection pipeline is connected.
Later, the automation follows this pattern:
Splunk Detection
↓
Extract Indicators
↓
Search MISP
↓
Reuse Existing Event
OR
Update/Create Intelligence
↓
Add New Attributes
The automation uses this same pattern: it searches for or reuses the relevant MISP event and adds attributes when they are not already present.
10. Create a Snapshot
Once MISP is installed and accessible, shut down the VM and create a VMware snapshot:
01-MISP-Installed
This gives you a recovery point before connecting MISP to the rest of the detection pipeline.
11. MISP Checkpoint
Before moving to the next component, you should now have:
- MISP installed on Ubuntu Server 24.04 LTS;
- MISP-01 using 192.168.95.131;
- HTTPS access to the MISP interface;
- working login access;
- an API authentication key prepared for automation;
- and a clean VMware snapshot.
MISP is now ready to provide the threat-intelligence and indicator-management layer of the lab.
Splunk Setup
Splunk will act as the SIEM and detection layer of the lab. It receives telemetry from the Windows endpoint, stores the events, and provides the searches and alerts that will later trigger the threat-intelligence workflow.
For this build:
Hostname: splunk-01
Operating System: Ubuntu Server 24.04 LTS
Lab IP: 192.168.95.133
Platform: Splunk Enterprise 10.4
The Windows endpoint will send its monitored data to Splunk through the Splunk Universal Forwarder over TCP port 9997.
The data path will initially look like:
Windows Endpoint
192.168.95.134
↓
Security / System / Firewall Logs
↓
Splunk Universal Forwarder
↓
TCP 9997
↓
Splunk-01
192.168.95.133
↓
index=main
1. Prepare the Splunk Server
Start Splunk-01 and verify the hostname and private IP address:
hostnamectl
ip addr
Confirm that the server is using:
Hostname: splunk-01
IP: 192.168.95.133
Test connectivity to the Windows endpoint:
ping -c 3 192.168.95.134
Then update Ubuntu:
sudo apt update
sudo apt upgrade -y
2. Download Splunk Enterprise
Download the Linux .deb package for Splunk Enterprise from the official Splunk download page.
Because Splunk download filenames and build identifiers change between releases, avoid hard-coding a package URL in the guide.
On the Splunk download page:
Splunk Enterprise → Linux → .deb → Download / copy the provided wget command
If you copy the direct download URL, download it to a simple local filename:
After obtaining the official download URL, you can download the package directly to the VM:
wget -O splunk.deb https://download.splunk.com/products/splunk/releases/10.4.0/linux/splunk-10.4.0-linux-amd64.deb
Version note: This lab was built and tested with Splunk Enterprise 10.4. Readers can use a current compatible 10.4 maintenance release where appropriate.
3. Install Splunk
Install the downloaded package:
sudo dpkg -i splunk.deb
After installation, Splunk should be available under:
/opt/splunk
Verify that the directory exists:
ls /opt/splunk
4. Start Splunk for the First Time
Start Splunk and accept the software licence:
sudo /opt/splunk/bin/splunk start --accept-license
During the initial setup, create the administrator credentials requested by Splunk.
Store the username and password securely.
Do not include the password in screenshots, source code, or the published project guide.
Splunk can then be configured to start automatically with the server:
sudo /opt/splunk/bin/splunk enable boot-start
You can check the application at any time with:
sudo /opt/splunk/bin/splunk status
Useful service commands throughout the project are:
sudo /opt/splunk/bin/splunk start
sudo /opt/splunk/bin/splunk stop
sudo /opt/splunk/bin/splunk restart
5. Open Splunk Web
From a system connected to the private lab network, open:
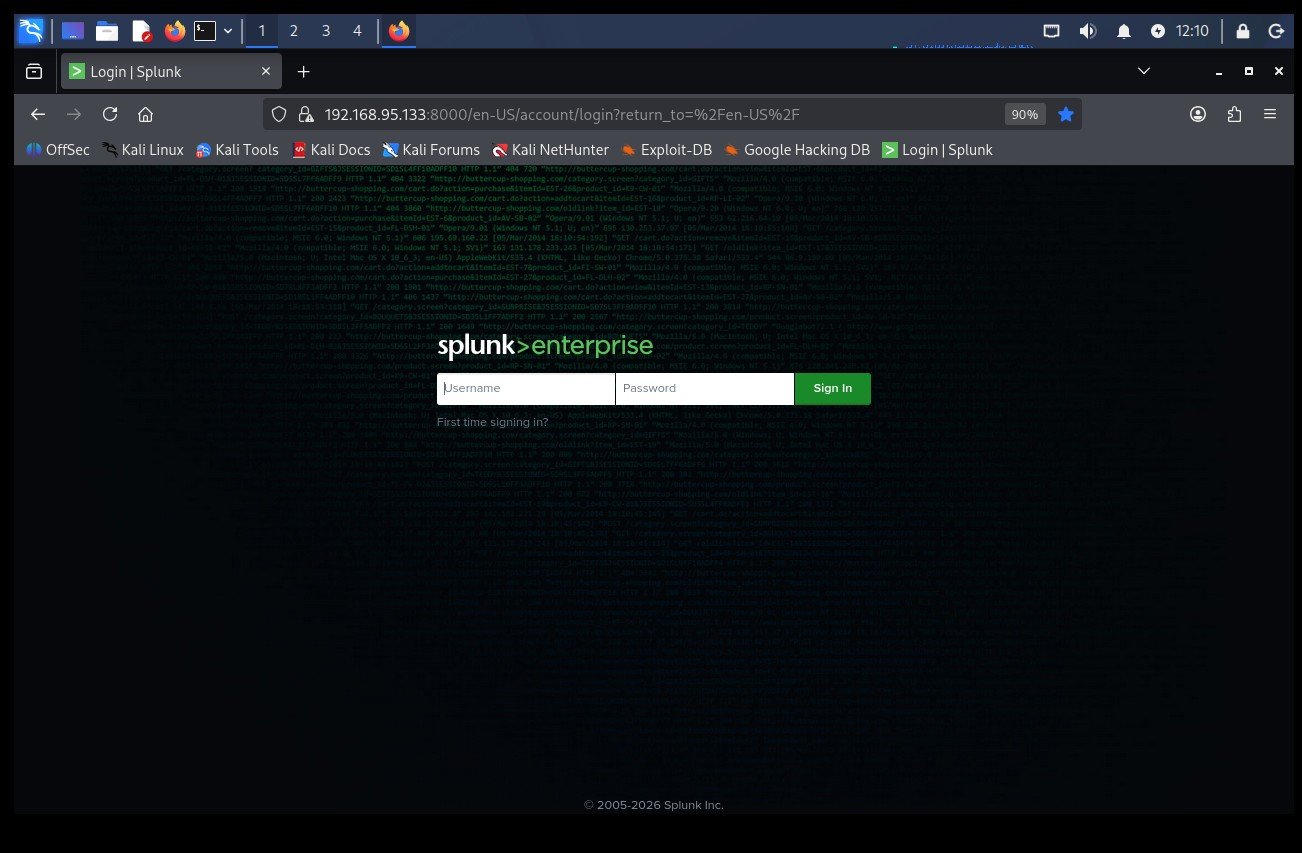
Figure 9. Splunk Web accessible on Splunk-01 at 192.168.95.133:8000.
At this initial stage, the goal is simply to verify that Splunk Web is running and that you can sign in.
Log in using the administrator account created during installation.
|
Security note: Splunk Web is configured for HTTPS later in this guide. First confirm that log ingestion and forwarding work correctly; TLS configuration can be added after the basic Splunk data path is stable. |
6. Enable the Splunk Receiver
The Windows Universal Forwarder needs a receiving port on the Splunk server.
In Splunk Web, go to:
Settings → Forwarding and receiving → Configure receiving
Then:
New Receiving Port → 9997
Save the configuration.
Port 9997 is the conventional Splunk receiving port for forwarder traffic. (Splunk documentation)
Verify from the Ubuntu terminal that Splunk is actually listening:
sudo ss -ltnp | grep 9997

Figure 10. Splunk receiver listening on TCP port 9997 for Universal Forwarder connections.
You should see a listener on:
0.0.0.0:9997
or an equivalent listening address.
If Port 9997 Does Not Listen
Do not assume the Windows forwarder is broken.
First verify the Splunk receiver.
The effective receiver configuration should contain:
[splunktcp://9997]
disabled = 0
You can inspect Splunk’s effective input configuration with:
sudo /opt/splunk/bin/splunk btool inputs list --debug
Look for the splunktcp://9997 stanza and make sure it is enabled.
Then restart Splunk:
sudo /opt/splunk/bin/splunk restart
and check the port again:
sudo ss -ltnp | grep 9997
This verification is important because a receiver can appear in the Splunk configuration while the operating system is not actually listening on the port.
7. Install the Universal Forwarder on Endpoint-01
Now move to the Windows endpoint:
Endpoint-01
192.168.95.134
Download the Splunk Universal Forwarder for Windows from the official Splunk website.
Install the forwarder using the Windows installer.
During configuration, set the receiving Splunk instance to:
Receiver: 192.168.95.133
Port: 9997
The Universal Forwarder is the component that collects endpoint data and sends it to the receiving Splunk Enterprise server. Splunk recommends the Universal Forwarder for collecting Windows Event Logs from remote Windows systems. (Splunk documentation)
After installation, verify that the service is running.
Open PowerShell as Administrator and run:
Get-Service SplunkForwarder
The service should show:
Status: Running
8. Verify the Forwarder Connection
From an Administrator PowerShell window on Endpoint-01:
& "C:\Program Files\SplunkUniversalForwarder\bin\splunk.exe" list forward-server
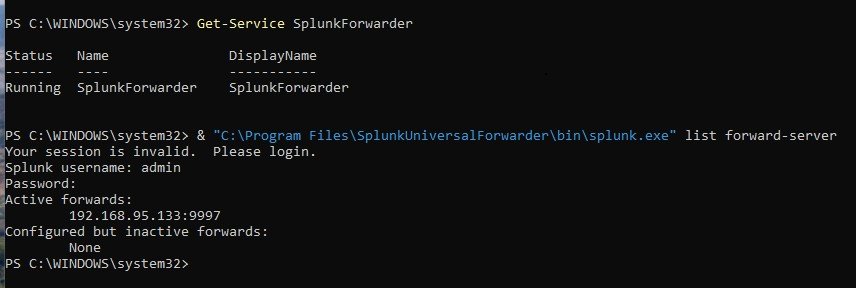
Figure 11. Endpoint-01 Universal Forwarder running and actively connected to Splunk-01 at 192.168.95.133:9997.
The active forwarding destination should include:
192.168.95.133:9997
If it does not, add the receiver:
& "C:\Program Files\SplunkUniversalForwarder\bin\splunk.exe" add forward-server 192.168.95.133:9997
Restart the forwarder after configuration changes:
& "C:\Program Files\SplunkUniversalForwarder\bin\splunk.exe" restart
The completed lab should now have:
Endpoint-01:134
↓
Universal Forwarder
↓
192.168.95.133:9997
↓
Splunk-01
9. Collect Windows Event Logs
For this project, collect the Windows Security and System event logs.
On Endpoint-01, open:
C:\Program Files\SplunkUniversalForwarder\etc\system\local\
Create or edit:
inputs.conf
Add:
[WinEventLog://Security]
disabled = 0
index = main
[WinEventLog://System]
disabled = 0
index = main
Splunk supports Windows Event Log collection through WinEventLog:// input stanzas on a Universal Forwarder. (Splunk documentation)
Save the file.
10. Enable Windows Firewall Logging
The main detection scenario later in this project will also use Windows Firewall telemetry.
On Endpoint-01, open:
Windows Defender Firewall with Advanced Security
Then open:
Windows Defender Firewall Properties
For the network profile being used by the lab, open:
Logging → Customize
Enable:
Log dropped packets: Yes
Log successful connections: Yes
The standard Windows Firewall log is normally stored at:
C:\Windows\System32\LogFiles\Firewall\pfirewall.log
Microsoft supports logging both successful connections and dropped packets through Windows Firewall logging settings. (Microsoft documentation)
11. Send the Firewall Log to Splunk
Return to the Universal Forwarder’s:
inputs.conf
and add:
[monitor://C:\Windows\System32\LogFiles\Firewall\pfirewall.log]
disabled = 0
index = main
Splunk’s file-monitor input allows a Universal Forwarder to continuously monitor a Windows log file and send new data to the receiving Splunk instance. (Splunk documentation)
Your inputs.conf should now contain the three data sources needed for this stage:
[WinEventLog://Security]
disabled = 0
index = main
[WinEventLog://System]
disabled = 0
index = main
[monitor://C:\Windows\System32\LogFiles\Firewall\pfirewall.log]
disabled = 0
index = main
Restart the Universal Forwarder:
& "C:\Program Files\SplunkUniversalForwarder\bin\splunk.exe" restart
12. Verify Data in Splunk
Return to Splunk Web and open:
Search & Reporting
Run:
index=main earliest=-15m
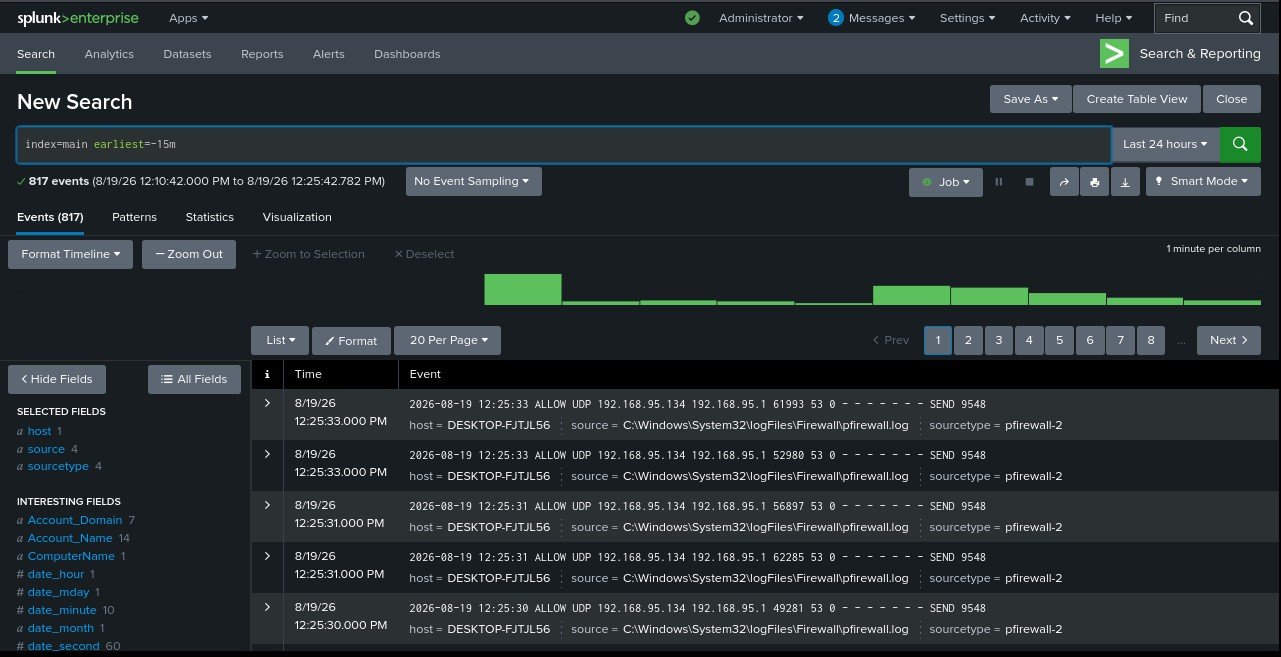
Figure 12. Windows Firewall telemetry from Endpoint-01 successfully ingested into the Splunk main index.
You should begin seeing events sent from Endpoint-01.
Look for data from:
- Windows Security;
- Windows System;
- Windows Firewall.
The completed lab uses these Windows data sources in index=main, with the Windows endpoint forwarding to Splunk over TCP 9997.
At this stage, we are only verifying ingestion.
Do not create the final detection search or automated response yet.
Those will be built later in the Detection Logic and Automation & Response Script sections.
13. Verify the Complete Splunk Data Path
Before continuing, confirm each stage individually:
Windows activity
↓
Firewall / Event Logs
↓
Universal Forwarder
↓
TCP 9997
↓
Splunk Enterprise
↓
index=main
On Splunk-01:
sudo ss -ltnp | grep 9997
On Endpoint-01:
Get-Service SplunkForwarder
Then verify fresh events in Splunk:
index=main earliest=-15m
If the forwarder service is running but no events appear, check the receiving port before reinstalling the forwarder. A receiver configuration can appear in Splunk even when the operating system is not actually listening on the expected port.
14. Create a Splunk Snapshot
Once the following are working:
- Splunk Enterprise;
- Splunk Web;
- TCP 9997;
- Windows Universal Forwarder;
- Security and System Event Logs;
- Windows Firewall log ingestion;
shut down Splunk-01 and create a VMware snapshot:
02-Splunk-Ingestion-Working
You now have a recovery point before detection searches and automation are added.
Splunk Checkpoint
Before moving forward, confirm that:
- Splunk Enterprise is running on 192.168.95.133;
- Splunk Web is accessible on port 8000;
- TCP 9997 is listening;
- the Universal Forwarder is running on 192.168.95.134;
- the forwarder shows 192.168.95.133:9997 as an active destination;
- Windows Security and System events appear in index=main;
- Windows Firewall telemetry appears in Splunk;
- and the working configuration has been snapshotted.
At this point, Splunk is ready to become the detection engine of the pipeline.
The next stages will turn this raw telemetry into detection logic and connect those detections to threat intelligence.
Prefer the entire lab in one place?
Get the complete Threat-Intelligence-Driven Detection Lab as one structured PDF bringing all four parts, implementation steps, screenshots, architecture, validation, and technical notes together.
If this piece gave you something to think about, you can support my writing here ☕

2 comments