
On this page
Build the Splunk detection logic, normalize alert fields, and connect the detection to a Python-based automated response workflow.
Building the Detection Logic
Splunk is now receiving telemetry from Endpoint-01, and the threat-intelligence layer is available for later enrichment. The next step is to turn the raw Windows Firewall activity into a structured detection that the automation workflow can use.
The detection used in this lab watches for the controlled connection from Endpoint-01 to the Kali test server:
Endpoint-01
192.168.95.134
↓
Windows Firewall Event
↓
Splunk
↓
Detect traffic to 192.168.95.135:8080
↓
Extract network fields
↓
Add detection context
↓
Return normalized fields
↓
Automation
The automation later expects the Splunk result to contain these six fields:
alert_name
source_ip
destination_ip
destination_port
url
filename
Splunk therefore needs to extract the network information from the raw firewall event and add the additional context required by the response workflow.
1. Identify the Controlled Traffic
The detection is based on a safe HTTP request from Endpoint-01 to the Kali test system.
The expected connection is:
Source:
192.168.95.134
Destination:
192.168.95.135
Destination Port:
8080
Protocol:
TCP
In Splunk, open:
Search & Reporting
Start with a simple search:
index=main sourcetype=pfirewall-2 “192.168.95.135” “8080” earliest=-15m
This searches the Windows Firewall telemetry for recent activity involving the Kali system and TCP port 8080.
A matching firewall event should contain values similar to:
ALLOW
TCP
192.168.95.134
192.168.95.135
<source-port>
8080
At this point, the event exists in Splunk, but the values still need to be converted into named fields that the automation can consume.
2. Extract the Firewall Fields
The Windows Firewall log stores the relevant values as space-separated fields.
Use rex to extract them from _raw:
| rex field=_raw “^(?<event_date>\S+)\s+(?<event_time>\S+)\s+(?<action>\S+)\s+(?<protocol>\S+)\s+(?<source_ip>\S+)\s+(?<destination_ip>\S+)\s+(?<source_port>\d+)\s+(?<destination_port>\d+)”
This creates the following Splunk fields:
event_date
event_time
action
protocol
source_ip
destination_ip
source_port
destination_port
For the controlled test, the important extracted values should be:
|
Field |
Expected value |
|
action |
ALLOW |
|
protocol |
TCP |
|
source_ip |
192.168.95.134 |
|
destination_ip |
192.168.95.135 |
|
destination_port |
8080 |
These values come directly from the Windows Firewall telemetry.
3. Add the Detection Name
The automation requires a consistent alert name so that the same detection can be identified across Splunk, MISP, and TheHive.
Add:
| eval alert_name=”Suspicious Software Update Retrieval Validation”
The same name will later be used when the response script creates or updates the corresponding MISP event and creates the TheHive investigation case.
4. Add the URL and Filename
The Windows Firewall log provides network-layer information such as IP addresses and ports, but it does not record the complete HTTP URL or requested filename.
Because this lab uses a known controlled test request, those values are added by the detection logic.
Construct the URL:
| eval url=”http://”.destination_ip.”:”.destination_port.”/test-file.txt”
Then assign the known test filename:
| eval filename=”test-file.txt”
This produces:
url
http://192.168.95.135:8080/test-file.txt
filename
test-file.txt
It is important to distinguish between extracted and constructed values.
The following values come from the firewall log:
action
protocol
source_ip
destination_ip
source_port
destination_port
The following values are added by the detection logic:
alert_name
url
filename
The URL and filename are therefore detection context for this controlled lab rather than values directly observed in the Windows Firewall log.
5. Normalize the Detection Output
The bridge script should not have to understand the original firewall-log format.
Splunk instead returns a clean set of named fields using table:
| table _time host action protocol source_ip destination_ip source_port destination_port alert_name url filename
Finally, return one matching detection result:
| head 1
This produces a predictable structured result that can later be written into Splunk’s results.csv.gz file and passed to the automation script.
The automation section already expects alert_name, source_ip, destination_ip, destination_port, url, and filename to be available in the Splunk result.
6. Use the Complete Detection Search
The complete detection search is:
index=main sourcetype=pfirewall-2 “192.168.95.135” “8080” _index_earliest=-6m _index_latest=now
| rex field=_raw “^(?<event_date>\S+)\s+(?<event_time>\S+)\s+(?<action>\S+)\s+(?<protocol>\S+)\s+(?<source_ip>\S+)\s+(?<destination_ip>\S+)\s+(?<source_port>\d+)\s+(?<destination_port>\d+)”
| eval alert_name=”Suspicious Software Update Retrieval Validation”
| eval url=”http://”.destination_ip.”:”.destination_port.”/test-file.txt”
| eval filename=”test-file.txt”
| table _time host action protocol source_ip destination_ip source_port destination_port alert_name url filename
| head 1
Run the search in Splunk.
A successful result should contain values similar to:
|
Field |
Expected value |
|
source_ip |
192.168.95.134 |
|
destination_ip |
192.168.95.135 |
|
destination_port |
8080 |
|
alert_name |
Suspicious Software Update Retrieval Validation |
|
url |
http://192.168.95.135:8080/test-file.txt |
|
filename |
test-file.txt |
7. Understand the Detection Window
The search uses:
_index_earliest=-6m _index_latest=now
The scheduled alert will later execute every five minutes.
Using a six-minute indexed-time window gives the detection a small overlap between scheduled runs so that recently indexed firewall activity is less likely to fall between execution windows.
The search then uses:
| head 1
to return one normalized result for the automation workflow.
Repeat detections are handled later by the response layer. For example, the MISP workflow can reuse an existing event rather than creating a new event every time the same detection occurs.
8. Understand Why Normalization Matters
The detection and response components have separate responsibilities:
Windows Firewall Log
↓
Splunk Detection
↓
rex extracts network values
↓
eval adds detection context
↓
table creates normalized output
↓
results.csv.gz
↓
cti_splunk_bridge.py
↓
cti_response.py
Splunk handles the raw telemetry and detection logic.
The bridge handles the Splunk result format.
The response script handles validation and the MISP and TheHive API operations.
Keeping these responsibilities separate makes the workflow easier to troubleshoot and prevents the response script from having to parse raw Windows Firewall logs itself.
Your existing automation section is already designed around this normalized interface and expects those six fields before launching cti_response.py.
9. Do Not Enable the Automated Response Yet
At this stage, only verify that the detection search produces the correct normalized fields.
Do not manually connect the search to the response script yet.
The next section, Automation & Response Script, will:
Save the detection
↓
Schedule it every five minutes
↓
Receive results.csv.gz
↓
Run cti_splunk_bridge.py
↓
Launch cti_response.py
↓
Send indicators to MISP
↓
Create the TheHive case
Detection Logic Checkpoint
Before moving to the automation section, confirm:
Windows Firewall telemetry is available in Splunk ✓
Traffic from 192.168.95.134 to 192.168.95.135:8080
can be identified ✓
rex extracts the network fields ✓
alert_name is added ✓
URL and filename context are added ✓
The final table contains the required automation fields ✓
The search returns one normalized result ✓
At this point, Splunk is no longer only collecting endpoint telemetry. It can identify the controlled activity and transform the raw firewall event into structured detection data ready for the automated response workflow.
Automation & Response Script
At this stage, Splunk can detect the suspicious activity and return the fields needed for investigation. The next step is to connect that detection to the intelligence and case-management layers automatically.
Instead of placing all response logic directly inside Splunk, this lab uses two Python components:
Splunk Scheduled Detection
↓
Normalized Result Fields
↓
results.csv.gz
↓
Splunk Bridge Script
↓
Response Script
↙ ↘
MISP TheHive
↓
Response Logs
Splunk provides scripted-alert results as a compressed results.csv.gz file. A small bridge script reads that file, validates the expected fields, and passes them to a separate response script. The response script then handles the MISP and TheHive API operations. This separation keeps Splunk-specific result handling separate from the CTI response logic.
The normalized interface uses these fields:
alert_name
source_ip
destination_ip
destination_port
url
filename
These fields are generated by the Splunk detection search and passed dynamically rather than being permanently hard-coded into the response script.
1. Prepare the Automation Files
The automation runs on Splunk-01.
Create two scripts:
/opt/splunk/bin/scripts/cti_splunk_bridge.py
/opt/splunk/bin/scripts/cti_response.py
Their responsibilities are different:
cti_splunk_bridge.py
Splunk
↓
results.csv.gz
↓
Read + validate result fields
↓
Launch cti_response.py
cti_response.py
Normalized detection fields
↓
Input validation
↓
MISP event / indicators
↓
TheHive case / observables
↓
Logging + exit status
Restricted script permissions and dedicated logs allow the automation to be tested and troubleshot without exposing API credentials.
Create the files:
sudo nano /opt/splunk/bin/scripts/cti_splunk_bridge.py
and
sudo nano /opt/splunk/bin/scripts/cti_response.py
2. Protect the Automation Files
Restrict both scripts:
sudo chown root:root /opt/splunk/bin/scripts/cti_splunk_bridge.py
sudo chown root:root /opt/splunk/bin/scripts/cti_response.py
sudo chmod 700 /opt/splunk/bin/scripts/cti_splunk_bridge.py
sudo chmod 700 /opt/splunk/bin/scripts/cti_response.py
Both automation scripts are restricted to root with mode 700.
3. Store the Response API Credentials
The response script needs authentication for:
MISP and TheHive
Keep these values outside the Python source code.
Create:
sudo nano /opt/splunk/etc/cti_secrets.conf
MISP_API_KEY=YOUR_MISP_API_KEY
THEHIVE_API_KEY=YOUR_THEHIVE_API_KEY
We will put only the required MISP and TheHive configuration in this protected file and never publish the real key values.
Restrict it:
sudo chown root:root /opt/splunk/etc/cti_secrets.conf
sudo chmod 600 /opt/splunk/etc/cti_secrets.conf
Store the MISP and TheHive API credentials in /opt/splunk/etc/cti_secrets.conf with root:root ownership and mode 600.
The response script connects to TheHive 5.7.3-1 over HTTPS and uses legacy-compatible API endpoints that this version accepts.
To verify TheHive’s HTTPS certificate, copy the public certificate from TheHive-01 to Splunk-01. Only the public certificate is required; do not copy the private key.
On TheHive-01:
sudo cp /etc/nginx/ssl/thehive/thehive.crt /tmp/thehive.crt
sudo chmod 644 /tmp/thehive.crt
scp /tmp/thehive.crt dmz@192.168.95.133:/home/dmz/thehive.crt
sudo rm /tmp/thehive.crt
On Splunk-01:
sudo mkdir -p /opt/splunk/etc/certs
sudo mv /home/dmz/thehive.crt /opt/splunk/etc/certs/thehive.crt
sudo chown root:root /opt/splunk/etc/certs/thehive.crt
sudo chmod 644 /opt/splunk/etc/certs/thehive.crt
Verify
ls -l /opt/splunk/etc/certs/thehive.crt
4. Build the Response Script
This is the main CTI automation script:
/opt/splunk/bin/scripts/cti_response.py
It should accept these values dynamically:
alert_name
source_ip
destination_ip
destination_port
url
filename
The response script should:
Detection Fields
↓
Validate Inputs
↓
Read Protected API Credentials
↓
Create / Update MISP Event
↓
Add Detection Indicators
↓
Create TheHive Case
↓
Add Observables
↓
Write Automation Log
The response script uses dynamic arguments instead of one fixed scenario and includes input validation, dry-run support, logging, and meaningful exit codes.
cti_response.py
#!/usr/bin/python3
import requests
import urllib3
from datetime import date
import datetime
import logging
import argparse
import ipaddress
from urllib.parse import urlparse
urllib3.disable_warnings(urllib3.exceptions.InsecureRequestWarning)
# =========================
# LOGGING
# =========================
LOG_FILE = “/opt/splunk/var/log/splunk/cti_response.log”
logging.basicConfig(
filename=LOG_FILE,
level=logging.INFO,
format=”%(asctime)s | %(levelname)s | %(message)s”
)
def log_info(message):
print(message)
logging.info(message)
def log_error(message):
print(message)
logging.error(message)
# =========================
# SECRET MANAGEMENT
# =========================
def load_secrets(path):
secrets = {}
with open(path, “r”, encoding=”utf-8″) as secret_file:
for raw_line in secret_file:
line = raw_line.strip()
if not line or line.startswith(“#”):
continue
key, separator, value = line.partition(“=”)
if not separator or not key.strip() or not value.strip():
raise RuntimeError(“Invalid entry in CTI secrets file”)
secrets[key.strip()] = value.strip()
required_keys = {
“MISP_API_KEY”,
“THEHIVE_API_KEY”
}
missing_keys = required_keys – secrets.keys()
if missing_keys:
raise RuntimeError(
f”Missing required secrets: {‘, ‘.join(sorted(missing_keys))}”
)
return secrets
SECRETS = load_secrets(“/opt/splunk/etc/cti_secrets.conf”)
# =========================
# CONFIG
# =========================
MISP_URL = “https://192.168.95.131”
MISP_API_KEY = SECRETS[“MISP_API_KEY”]
THEHIVE_URL = “https://192.168.95.132”
THEHIVE_CA_CERT = “/opt/splunk/etc/certs/thehive.crt”
THEHIVE_API_KEY = SECRETS[“THEHIVE_API_KEY”]
# Neutral defaults used for manual testing.
# Splunk supplies these values dynamically during automated execution.
ALERT_NAME = “ Suspicious Software Update Retrieval Validation”
SOURCE_IP = “192.168.95.134”
DESTINATION_IP = “192.168.95.135”
DETECTED_URL = “http://192.168.95.135:8080/test-file.txt”
FILENAME = “test-file.txt”
PORT = “8080”
# =========================
# ARGUMENTS
# =========================
def parse_arguments():
parser = argparse.ArgumentParser(
description=”Threat Detection Lab automated CTI response workflow”
)
parser.add_argument(
“–alert-name”,
default=ALERT_NAME
)
parser.add_argument(
“–source-ip”,
default=SOURCE_IP
)
parser.add_argument(
“–destination-ip”,
default=DESTINATION_IP
)
parser.add_argument(
“–port”,
default=PORT
)
parser.add_argument(
“–url”,
default=DETECTED_URL
)
parser.add_argument(
“–filename”,
default=FILENAME
)
parser.add_argument(
“–dry-run”,
action=”store_true”,
help=”Validate inputs without contacting MISP or TheHive”
)
return parser.parse_args()
# =========================
# INPUT VALIDATION
# =========================
def validate_inputs():
errors = []
for label, value in (
(“source IP”, SOURCE_IP),
(“destination IP”, DESTINATION_IP),
):
try:
ipaddress.ip_address(value)
except ValueError:
errors.append(f”Invalid {label}: {value}”)
try:
port_number = int(PORT)
if not 1 <= port_number <= 65535:
raise ValueError
except ValueError:
errors.append(f”Invalid port: {PORT}”)
parsed_url = urlparse(DETECTED_URL)
if (
parsed_url.scheme not in (“http”, “https”)
or not parsed_url.hostname
):
errors.append(f”Invalid URL: {DETECTED_URL}”)
if not ALERT_NAME.strip():
errors.append(“Alert name cannot be empty”)
if (
not FILENAME.strip()
or “/” in FILENAME
or “\\” in FILENAME
):
errors.append(f”Invalid filename: {FILENAME}”)
if errors:
raise ValueError(“; “.join(errors))
# =========================
# MISP
# =========================
def find_existing_event():
headers = {
“Authorization”: MISP_API_KEY,
“Accept”: “application/json”,
“Content-Type”: “application/json”
}
payload = {
“value”: f”{ALERT_NAME} – Automated Splunk Detection”,
“searchall”: True
}
response = requests.post(
f”{MISP_URL}/events/restSearch”,
headers=headers,
json=payload,
verify=False,
timeout=30
)
print(
“MISP existing-event search:”,
response.status_code
)
if response.status_code != 200:
return None
results = response.json().get(“response”, [])
if not results:
return None
return results[0][“Event”][“id”]
def create_misp_event():
existing_id = find_existing_event()
if existing_id:
print(
f”Existing event found, reusing ID {existing_id}”
)
add_misp_attribute(
existing_id,
“Other”,
“text”,
f”Re-detected at {datetime.datetime.now().isoformat()}”,
“Additional automated detection occurrence”
)
return existing_id
headers = {
“Authorization”: MISP_API_KEY,
“Accept”: “application/json”,
“Content-Type”: “application/json”
}
payload = {
“Event”: {
“info”: (
f”{ALERT_NAME} – Automated Splunk Detection”
),
“date”: str(date.today()),
“threat_level_id”: “2”,
“analysis”: “1”,
“distribution”: “0”
}
}
response = requests.post(
f”{MISP_URL}/events/add”,
headers=headers,
json=payload,
verify=False,
timeout=30
)
print(
“MISP event:”,
response.status_code,
response.text
)
if response.status_code not in [200, 201]:
return None
return response.json()[“Event”][“id”]
def add_misp_attribute(
event_id,
category,
attr_type,
value,
comment
):
headers = {
“Authorization”: MISP_API_KEY,
“Accept”: “application/json”,
“Content-Type”: “application/json”
}
payload = {
“Attribute”: {
“event_id”: event_id,
“category”: category,
“type”: attr_type,
“value”: value,
“comment”: comment,
“to_ids”: False,
“distribution”: “0”
}
}
response = requests.post(
f”{MISP_URL}/attributes/add/{event_id}”,
headers=headers,
json=payload,
verify=False,
timeout=30
)
print(
f”MISP attribute {value}:”,
response.status_code,
response.text
)
# =========================
# THEHIVE
# =========================
def create_thehive_case():
headers = {
“Authorization”: f”Bearer {THEHIVE_API_KEY}”,
“Content-Type”: “application/json”
}
payload = {
“title”: (
f”{ALERT_NAME} – Automated Splunk Alert”
),
“description”: (
f”Splunk detected activity associated with “
f”{ALERT_NAME}. “
f”Source {SOURCE_IP} communicated with “
f”destination {DESTINATION_IP} on port {PORT}. “
f”The detected URL was {DETECTED_URL}, and the “
f”associated filename was {FILENAME}. “
f”Indicators were sent to MISP, and this case “
f”was created for analyst investigation.”
),
“severity”: 2,
“tlp”: 2,
“pap”: 2,
“tags”: [
“splunk”,
“misp”,
“cti”,
“automated-alert”,
“threat-detection-lab”
]
}
response = requests.post(
f”{THEHIVE_URL}/api/case”,
headers=headers,
json=payload,
verify=THEHIVE_CA_CERT,
timeout=30
)
print(
“TheHive case:”,
response.status_code,
response.text
)
if response.status_code not in [200, 201]:
return None
return response.json()[“_id”]
def add_thehive_observable(
case_id,
data_type,
data,
message
):
headers = {
“Authorization”: f”Bearer {THEHIVE_API_KEY}”,
“Content-Type”: “application/json”
}
payload = {
“dataType”: data_type,
“data”: data,
“message”: message,
“tlp”: 2,
“pap”: 2,
“tags”: [
“automated-from-splunk”
]
}
response = requests.post(
f”{THEHIVE_URL}/api/case/{case_id}/artifact”,
headers=headers,
json=payload,
verify=THEHIVE_CA_CERT,
timeout=30
)
print(
f”TheHive observable {data}:”,
response.status_code,
response.text
)
# =========================
# MAIN WORKFLOW
# =========================
def main():
global ALERT_NAME
global SOURCE_IP
global DESTINATION_IP
global PORT
global DETECTED_URL
global FILENAME
args = parse_arguments()
ALERT_NAME = args.alert_name
SOURCE_IP = args.source_ip
DESTINATION_IP = args.destination_ip
PORT = str(args.port)
DETECTED_URL = args.url
FILENAME = args.filename
try:
validate_inputs()
except ValueError as error:
log_error(
f”Input validation failed: {error}”
)
return 2
log_info(
f”CTI workflow started: alert={ALERT_NAME}”
)
log_info(
f”Indicators received: “
f”source={SOURCE_IP}, “
f”destination={DESTINATION_IP}, “
f”port={PORT}, “
f”url={DETECTED_URL}, “
f”filename={FILENAME}”
)
if args.dry_run:
log_info(
“Dry-run validation completed; “
“no MISP or TheHive API calls were made”
)
return 0
# ————————-
# MISP RESPONSE
# ————————-
event_id = create_misp_event()
if event_id:
add_misp_attribute(
event_id,
“Network activity”,
“ip-src”,
SOURCE_IP,
“Source IP detected by Splunk”
)
add_misp_attribute(
event_id,
“Network activity”,
“ip-dst”,
DESTINATION_IP,
“Destination IP detected by Splunk”
)
add_misp_attribute(
event_id,
“Network activity”,
“url”,
DETECTED_URL,
f”URL associated with {ALERT_NAME}”
)
add_misp_attribute(
event_id,
“Payload delivery”,
“filename”,
FILENAME,
f”Filename associated with {ALERT_NAME}”
)
add_misp_attribute(
event_id,
“Network activity”,
“port”,
PORT,
“Destination port detected by Splunk”
)
# ————————-
# THEHIVE RESPONSE
# ————————-
case_id = create_thehive_case()
if case_id:
add_thehive_observable(
case_id,
“ip”,
SOURCE_IP,
“Detected source IP”
)
add_thehive_observable(
case_id,
“ip”,
DESTINATION_IP,
“Detected destination IP”
)
add_thehive_observable(
case_id,
“url”,
DETECTED_URL,
f”URL associated with {ALERT_NAME}”
)
add_thehive_observable(
case_id,
“filename”,
FILENAME,
f”Filename associated with {ALERT_NAME}”
)
add_thehive_observable(
case_id,
“other”,
f”TCP/{PORT}”,
“Detected network port”
)
log_info(
“CTI workflow completed successfully”
)
return 0
if __name__ == “__main__”:
raise SystemExit(main())
5. Add Input Validation and Dry-Run Mode
Before connecting the script to a live Splunk alert, validate the incoming values.
The script should reject:
- invalid IP addresses;
- ports outside the valid range;
- malformed URLs;
- blank alert names;
- unsafe filenames.
A –dry-run option should allow the values to be tested without contacting MISP or TheHive. This lets you test the interface on its own before contacting MISP or TheHive.
Example safe test:
sudo /usr/bin/python3 /opt/splunk/bin/scripts/cti_response.py \
–alert-name “ Suspicious Software Update Retrieval Validation” \
–source-ip “192.168.95.134” \
–destination-ip “192.168.95.135” \
–port “8080” \
–url “http://192.168.95.135:8080/test-file.txt” \
–filename “test-file.txt” \
–dry-run
A successful dry run should validate the supplied fields and exit without creating any MISP event or TheHive case.

Figure 18. Sanitized CTI response script successfully validating dynamic detection fields in dry-run mode without contacting MISP or TheHive.
6. Build the Splunk Bridge
Now create the bridge script:
sudo nano /opt/splunk/bin/scripts/cti_splunk_bridge.py
The bridge exists because Splunk scripted alerts do not automatically pass arbitrary SPL fields as normal command-line arguments. Instead, Splunk supplies the alert results through a compressed CSV results file.
The bridge workflow is:
results.csv.gz
↓
Decompress CSV
↓
Read First Result
↓
Validate Required Fields
↓
Launch cti_response.py
↓
Pass Dynamic Arguments
The required fields are:
alert_name
source_ip
destination_ip
destination_port
url
filename
bridge-script
#!/usr/bin/python3
import csv
import gzip
import os
import subprocess
import sys
from datetime import datetime
RESULT_SCRIPT = “/opt/splunk/bin/scripts/cti_response.py”
LOG_FILE = “/opt/splunk/var/log/splunk/cti_bridge.log”
def write_log(level, message):
with open(LOG_FILE, “a”, encoding=”utf-8″) as log:
log.write(f”{datetime.now().isoformat()} | {level} | {message}\n”)
def main():
results_file = os.environ.get(“SPLUNK_ARG_8”)
if not results_file:
for argument in reversed(sys.argv[1:]):
if argument.endswith(“results.csv.gz”):
results_file = argument
break
if not results_file:
write_log(“ERROR”, “No Splunk results file was received”)
return 2
try:
with gzip.open(
results_file,
“rt”,
encoding=”utf-8-sig”,
newline=””
) as handle:
reader = csv.DictReader(handle)
row = next(reader, None)
except Exception as error:
write_log(
“ERROR”,
f”Could not read results file: {type(error).__name__}: {error}”
)
return 1
if not row:
write_log(“ERROR”, “Splunk results file contained no rows”)
return 2
required_fields = [
“alert_name”,
“source_ip”,
“destination_ip”,
“destination_port”,
“url”,
“filename”,
]
missing = [
field for field in required_fields
if not row.get(field, “”).strip()
]
if missing:
write_log(
“ERROR”,
“Missing required fields: ” + “, “.join(missing)
)
return 2
command = [
“/usr/bin/python3”,
RESULT_SCRIPT,
“–alert-name”, row[“alert_name”],
“–source-ip”, row[“source_ip”],
“–destination-ip”, row[“destination_ip”],
“–port”, row[“destination_port”],
“–url”, row[“url”],
“–filename”, row[“filename”],
]
write_log(
“INFO”,
(
f”Launching CTI response: alert={row[‘alert_name’]}, “
f”source={row[‘source_ip’]}, “
f”destination={row[‘destination_ip’]}, “
f”port={row[‘destination_port’]}, “
f”filename={row[‘filename’]}”
)
)
try:
result = subprocess.run(
command,
capture_output=True,
text=True,
timeout=120,
check=False
)
except Exception as error:
write_log(
“ERROR”,
f”CTI response launch failed: {type(error).__name__}: {error}”
)
return 1
write_log(
“INFO” if result.returncode == 0 else “ERROR”,
f”CTI response completed with exit code {result.returncode}”
)
if result.stderr.strip():
write_log(“ERROR”, result.stderr.strip()[-500:])
return result.returncode
if __name__ == “__main__”:
raise SystemExit(main())
7. Understand results.csv.gz
This part is important and should not be skipped.
Splunk’s scripted-alert mechanism passes the search results as a compressed CSV file called:
results.csv.gz
During testing, the initial result contained mainly metadata and _raw. The SPL search therefore had to explicitly extract and return the fields required by the bridge.
The automation depends on the result containing:
alert_name
source_ip
destination_ip
destination_port
url
filename
8. Prepare the SPL Output
Your detection search should finish by normalizing the values required by the automation.
The important pattern is:
| rex …
| eval alert_name=” Suspicious Software Update Retrieval Validation”
| eval url=…
| eval filename=…
| table _time host action protocol source_ip destination_ip source_port destination_port alert_name url filename
| head 1
Use rex, eval, and table so the named fields appear inside results.csv.gz.
9. Connect the Scheduled Splunk Alert
Save the detection search as a scheduled alert.
For this lab, a five-minute schedule is suitable:
Detection Search
↓
Every 5 Minutes
↓
If Result Exists
↓
Run cti_splunk_bridge.py
A five-minute schedule works well for this lab.
The bridge then receives the compressed Splunk result and starts the response workflow automatically.
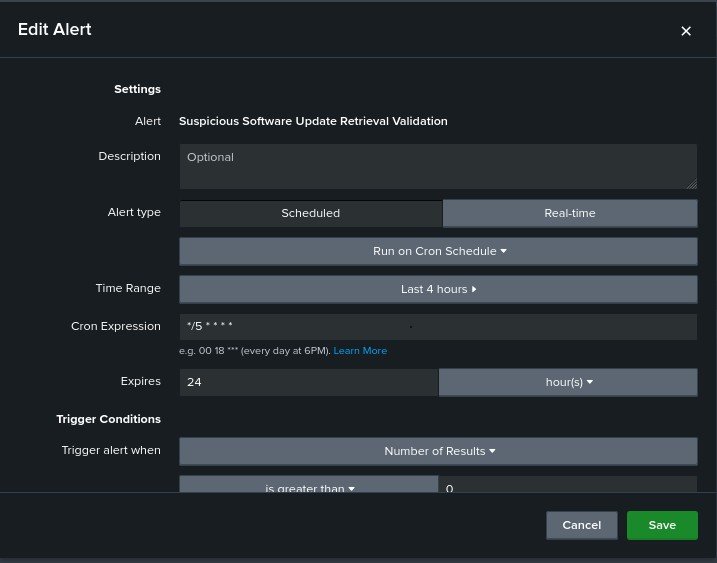
Figure 19. Scheduled Splunk detection configured to run every five minutes and trigger when matching results are returned.
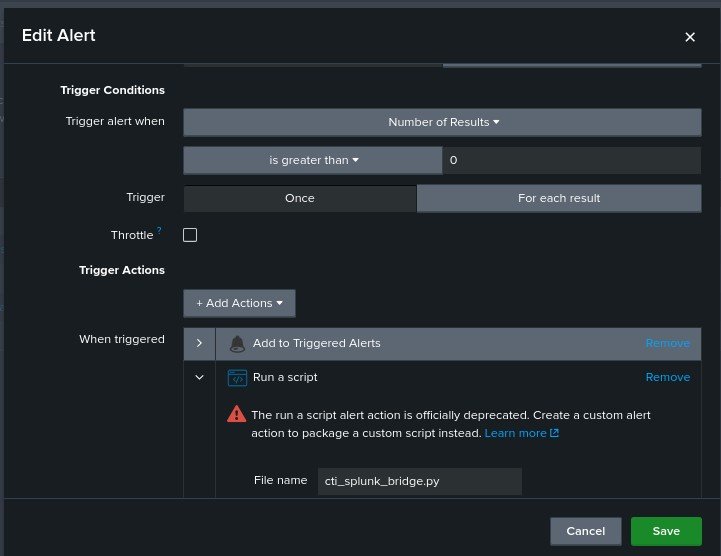
Figure 20. Splunk alert action configured to launch the CTI bridge script when the detection triggers.
Note: Splunk marks the built-in Run a script alert action as deprecated. This lab uses it to demonstrate the scripted-alert workflow.
10. Test the Response Script Safely
Before testing the complete alert chain, run the response script manually using –dry-run.
Then verify the exit code:
echo $?
Expected : 0
for a valid dry-run.
Invalid inputs should return a non-zero exit code rather than continuing to the APIs. Exit codes make it possible to test invalid inputs without continuing to the downstream APIs.
11. Run the Automated Workflow
Once the individual components are working, generate a fresh controlled detection.
The resulting path should be:
Windows Endpoint
↓
Universal Forwarder
↓
Splunk Detection
↓
results.csv.gz
↓
Bridge Script
↓
Response Script
↙ ↘
MISP TheHive
Following this path, endpoint activity reaches Splunk, the detection is normalized, the bridge and response script execute, and the results are sent automatically to MISP and TheHive.
12. Verify the Automation Logs
The bridge and response script should each maintain a dedicated log.
The bridge and response script use these dedicated logs:
/opt/splunk/var/log/splunk/cti_bridge.log
/opt/splunk/var/log/splunk/cti_response.log
Check them with:
sudo cat /opt/splunk/var/log/splunk/cti_bridge.log
and
sudo cat /opt/splunk/var/log/splunk/cti_response.log
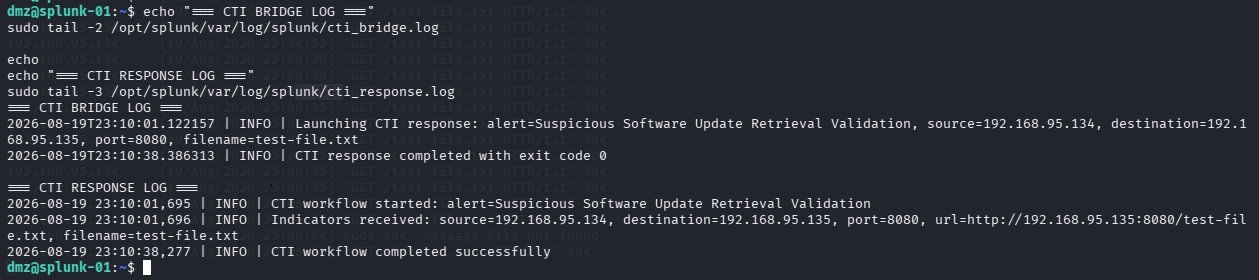
Figure 21. Bridge and response logs confirming successful automated processing of the Splunk detection and completion of the CTI response workflow.
The logs should confirm that:
Splunk result received ✓
Required fields validated ✓
Response script launched ✓
MISP operation completed ✓
TheHive operation completed ✓
Exit code 0
Dedicated bridge and CTI logs help with troubleshooting and provide useful audit evidence.
13. Automation Checkpoint
Before moving to TheHive Investigation Workflow, verify:
Splunk produces the required normalized fields ✓
results.csv.gz reaches the bridge ✓
Bridge validates the required fields ✓
Response script receives dynamic values ✓
Dry-run validation succeeds ✓
MISP API operation succeeds ✓
TheHive API operation succeeds ✓
API keys remain outside source code ✓
Bridge and response logs record successful execution ✓
At this point, the detection is no longer just a Splunk search. It has become an automated response workflow capable of moving structured detection data into the intelligence and investigation layers.
Prefer the entire lab in one place?
Get the complete Threat-Intelligence-Driven Detection Lab as one structured PDF bringing all four parts, implementation steps, screenshots, architecture, validation, and technical notes together.
If this piece gave you something to think about, you can support my writing here ☕

3 comments