
On this page
Turn automated detections into investigation cases, map supported behaviour to MITRE ATT&CK, and validate the complete end-to-end detection pipeline.
TheHive Integration Workflow
TheHive provides the investigation layer of the lab. Splunk identifies the activity, the automation script normalizes the detection data, and TheHive converts that information into a structured case that an analyst can review.
The workflow is :
Splunk Detection
↓
CTI Response Script
↓
TheHive REST API
↓
Case Creation
↓
Add Observables
↓
Analyst Investigation
This lab uses TheHive 5.7.3-1. The automation demonstrated in this lab successfully uses the /api/case and /api/case/{case_id}/artifact endpoints for case and observable creation. Current TheHive 5 documentation uses the /api/v1/ API, so readers using another release should verify the API paths supported by their installed version.
1. Request and Activate the TheHive Community License
TheHive 5.3 and later on-premises installations include a 14-day Platinum trial. After the trial expires, the instance transitions to read-only mode unless a valid licence is activated. For this lab, a free Community licence was requested through StrangeBee before completing the automated case-management configuration. For this lab, a Community licence was required before the case-management account could be configured for automated case creation.
Create a StrangeBee account and request a Community licence through the StrangeBee licensing portal. The request may require account verification before the licence becomes available, so check the registered email address for the approval or activation message before continuing.
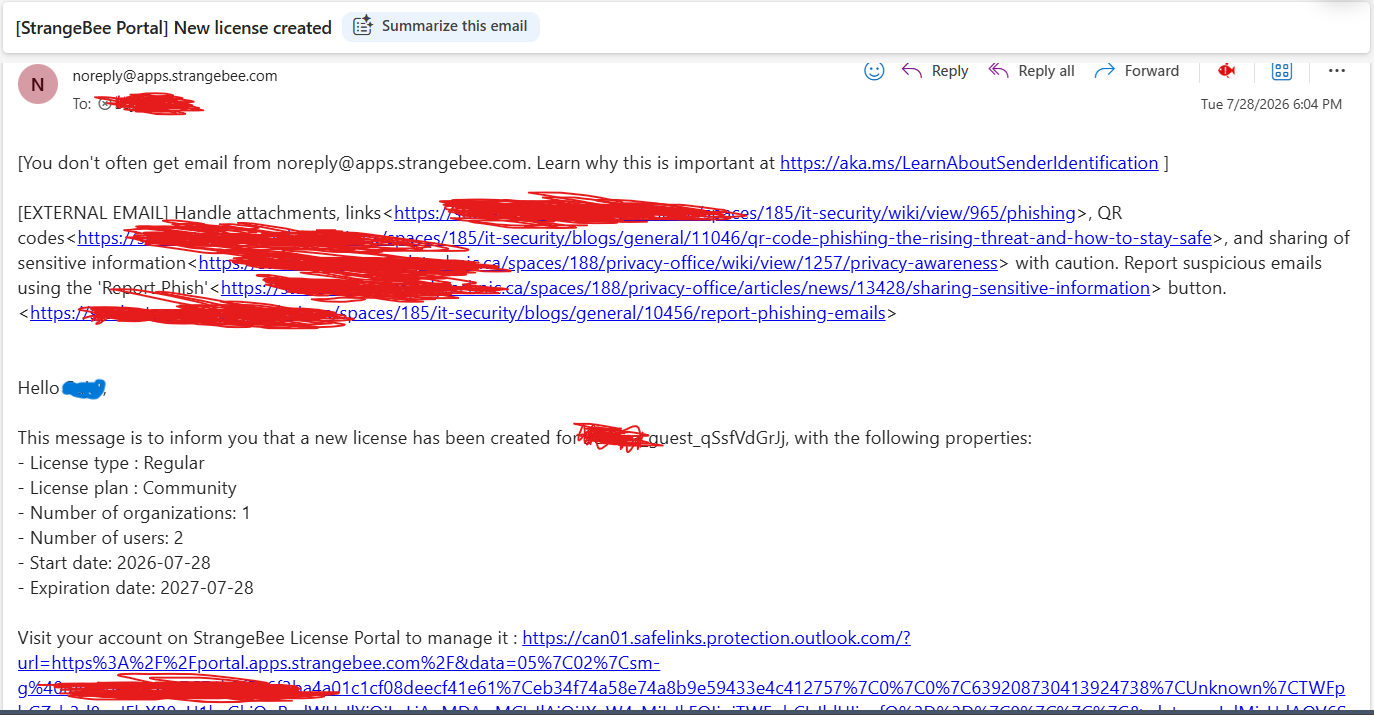
Figure 22. StrangeBee email confirming creation of the requested TheHive Community licence.
Once the request has been approved, sign in to the StrangeBee License Portal and open the licence details. Confirm that the Community licence has been created and is available for the TheHive instance.
Platform Management 🡪 License 🡪Update the current license
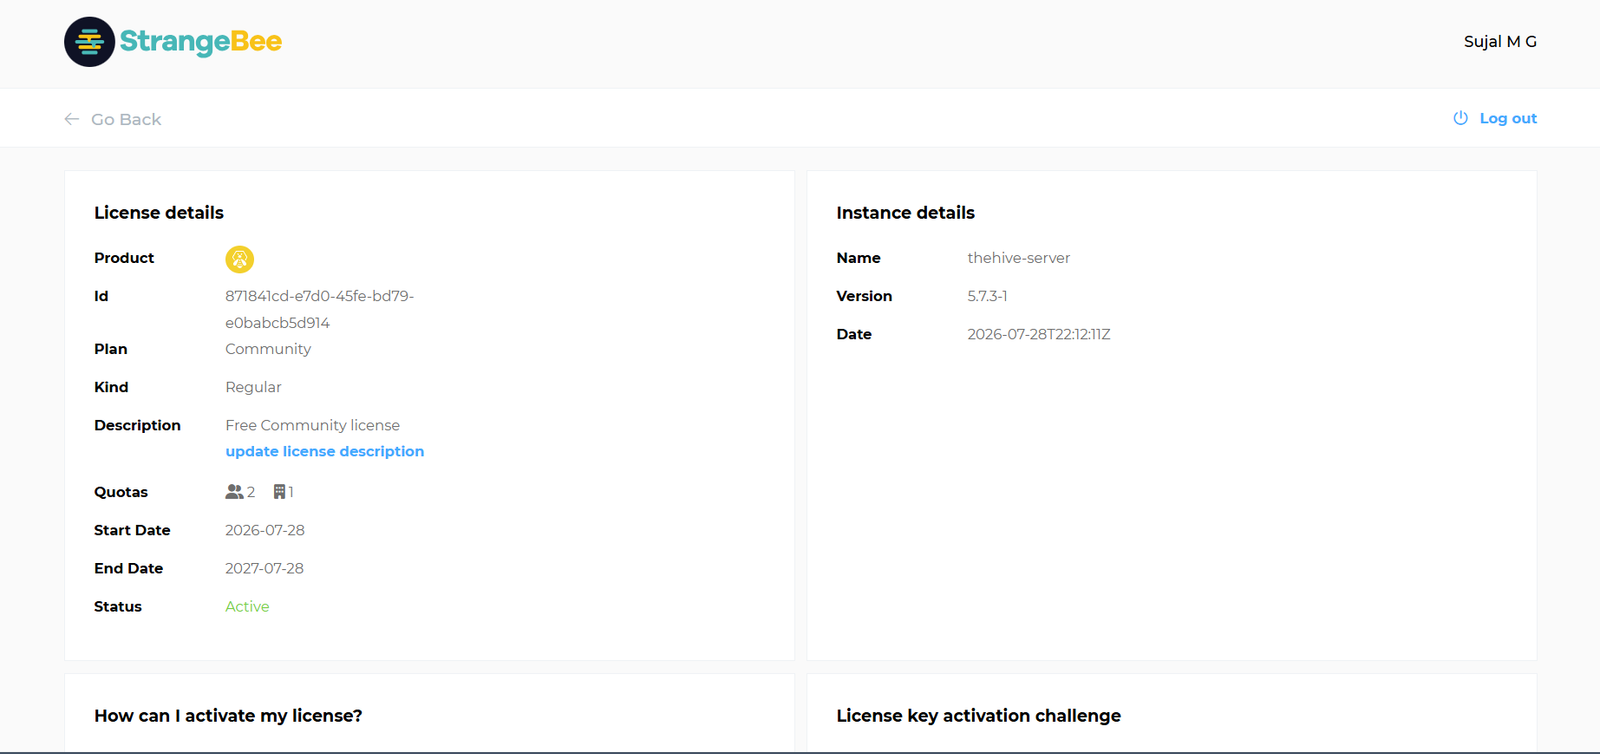
Figure 23. StrangeBee License Portal showing the active Community licence and its associated TheHive instance.
Copy the activation challenge shown by TheHive.
Then open the StrangeBee licensing portal:
License 🡪Activate/View details 🡪Paste the activation challenge 🡪 Activate license 🡪Copy the generated license key
Return to TheHive, paste the generated licence key into the licence field, and activate it.
The current StrangeBee documentation follows this challenge → portal → licence-key → activation workflow.
After activation, return to Platform Management → License and confirm that TheHive recognises the Community licence. The licence page should show Community together with the applicable user and organization limits. 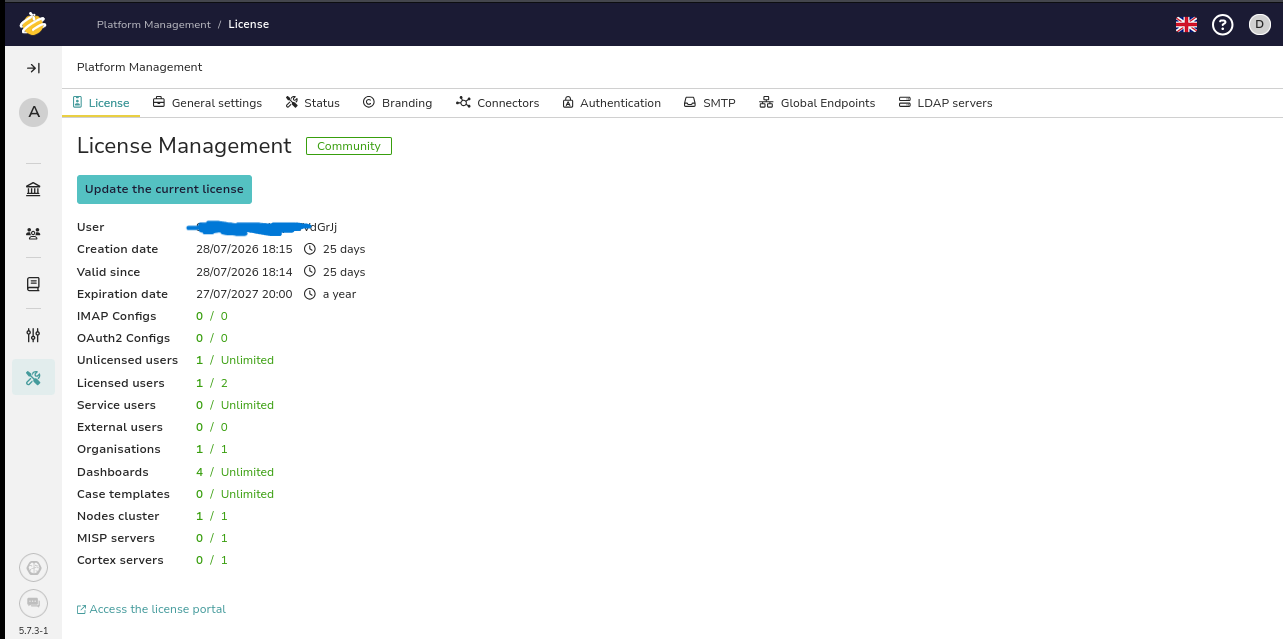
Figure 24. TheHive licence activation workflow using the activation challenge with the StrangeBee License Portal.
2. Configure the Operational Organization and Analyst Account
This part is also important because having an API key alone is not enough.
Create the operational organization for the lab and assign the analyst account to it. The account used by the automation needs a profile with permission to create and manage cases.
The setup sequence is:
Community Licence Active 🡪 Create Operational Organization 🡪 Assign Analyst Account 🡪 Assign Case-Management Permissions 🡪 Set Default Organization 🡪 Generate / Renew API Key
During testing, authentication could succeed while case creation still returned a 403 because the account did not yet have effective manageCase/create permission in the correct organization context. The configuration used here includes the active Community licence, operational organization, Analyst profile, default organization, and renewed API key.
3. Verify TheHive Access
TheHive-01 uses:
192.168.95.132
Open:
Sign in with an authorised TheHive account and confirm that the case-management interface loads correctly.
The automation account must have permission to create cases and add observables. The API key itself should remain stored outside the Python source code in the protected credentials file configured earlier.
The response script reads:
/opt/splunk/etc/cti_secrets.conf
And uses:
THEHIVE_API_KEY
For API authentication.
4. Understand the Case-Creation Request
When the Splunk alert triggers, cti_response.py sends a request to:
POST /api/case
The request uses Bearer authentication:
Authorization: Bearer <THEHIVE_API_KEY>
The generated case includes:
Title
Description
Severity
TLP
PAP
Tags
The title is created dynamically from the detection name:
Suspicious Software Update Retrieval Validation – Automated Splunk Alert
The description contains the detection context received from Splunk, including:
Source IP
Destination IP
Destination port
Detected URL
Filename
The case also receives the following tags:
splunk
misp
cti
automated-alert
threat-detection-lab
The response script uses severity 2, TLP 2, and PAP 2 when creating the case.
5. Create the Case Automatically
No case needs to be created manually during the detection workflow.
After the response script receives the normalized Splunk fields, it calls the TheHive API. A successful response returns the new case identifier, which is then used when attaching observables.
The flow is:
Normalized Detection
↓
Build Case Payload
↓
POST /api/case
↓
Receive Case ID
↓
Attach Observables
If the API does not return HTTP 200 or 201, the script treats case creation as unsuccessful and does not attempt to use an invalid case identifier.
6. Verify the Automated Case
After triggering the detection, open TheHive → Cases.
Locate the case named:
Suspicious Software Update Retrieval Validation – Automated Splunk Alert
Open the case and verify that the description contains the detection values produced by Splunk.
For the current lab test, the investigation context should include values corresponding to:
Source IP: 192.168.95.134
Destination IP: 192.168.95.135
Port: 8080
URL: http://192.168.95.135:8080/test-file.txt
Filename: test-file.txt
The important point is that these values were passed through the automation pipeline rather than entered manually in TheHive. The implementation creates the case automatically with a dynamic title and description.
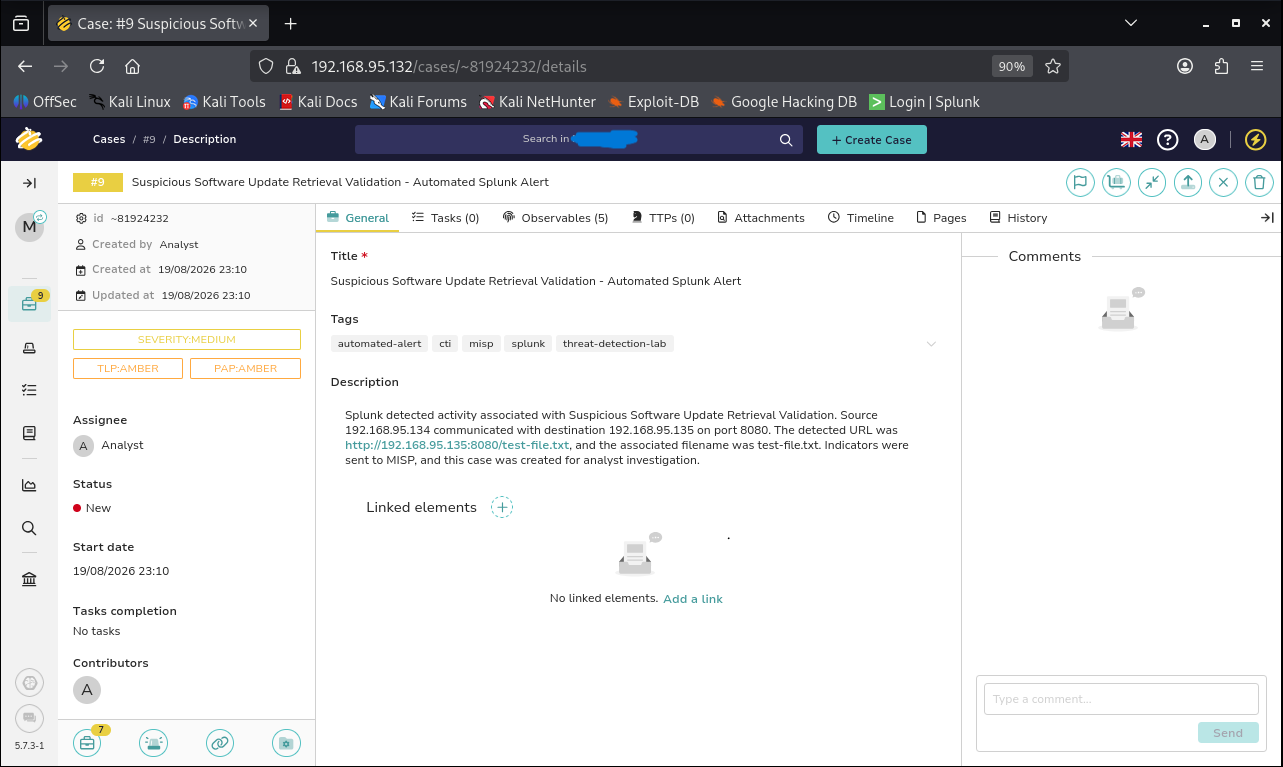
Figure 25. TheHive case automatically created from the normalized Splunk detection with dynamic investigation context.
7. Add Detection Observables
After creating the case, the response script attaches the detection values as TheHive observables.
The lab automation uses:
POST /api/case/{case_id}/artifact
for this operation.
This endpoint successfully created the five observables shown in this lab. Current TheHive 5 documentation uses POST /api/v1/case/{caseId}/observable, so implementations on other releases should verify the appropriate API endpoint.
Each observable includes:
dataType
data
message
TLP
PAP
Tags
The automation adds the tag:
automated-from-splunk
to each observable.
Five observables are added to the case:
|
Observable |
Example |
|
Source IP |
192.168.95.134 |
|
Destination IP |
192.168.95.135 |
|
URL |
http://192.168.95.135:8080/test-file.txt |
|
Filename |
test-file.txt |
|
Network port |
TCP/8080 |
The workflow produces five observables automatically from the same detection that creates the case.
8. Review the Observables
Inside the case, open the Observables view.
Verify that the five detection values are present and that they match the information recorded by Splunk and MISP.
The observables turn the original alert into structured investigation data. Instead of leaving the source IP, destination, URL, filename, and port buried inside an alert description, TheHive stores them as individual objects that can be reviewed during triage.
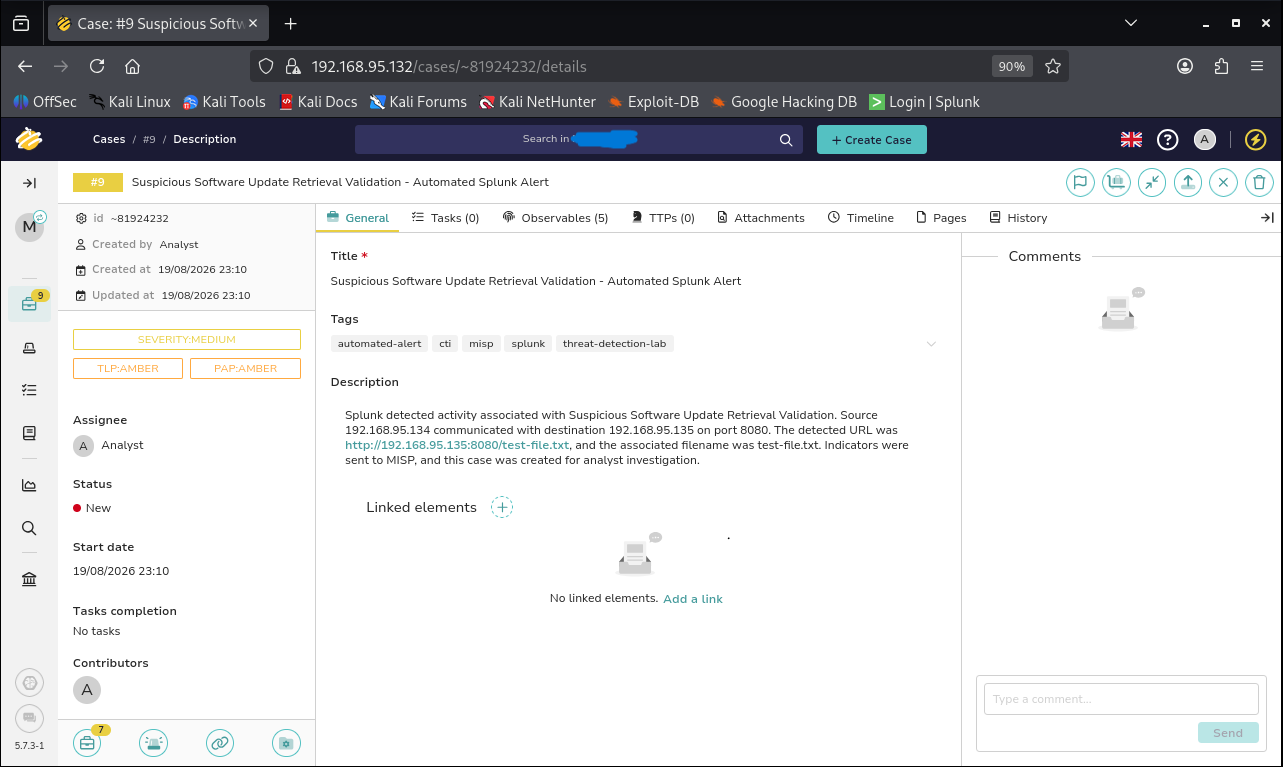
Figure 26. Five observables automatically attached to the TheHive case
9. Correlate the Case with MISP
The same detection is also sent to MISP by the response workflow.
TheHive and MISP therefore represent two different views of the same event:
Detection
↓
Response Script
↙ ↘
MISP TheHive
↓ ↓
Indicators Case
+
Observables
MISP acts as the threat-intelligence repository, while TheHive provides the investigation record.
During investigation, compare the case observables with the corresponding MISP indicators to confirm that the source IP, destination IP, URL, filename, and port are consistent across both systems.
10. Analyst Investigation Workflow
Once the case exists, the automated portion of the workflow is complete and analyst investigation can begin.
A practical investigation sequence is:
Review Case
↓
Check Detection Context
↓
Review Five Observables
↓
Compare with MISP Indicators
↓
Assess Severity and Relevance
↓
Document Investigation Findings
Automation does not make the final security judgement. Its purpose is to move the relevant detection context into TheHive quickly and consistently so the analyst can begin with structured evidence instead of manually rebuilding the incident from raw logs.
11. Verify the Integration
The integration is working correctly when:
Splunk detection triggers ✓
Response script receives dynamic values ✓
TheHive API authenticates successfully ✓
Case is created automatically ✓
Dynamic description is populated ✓
Five observables are attached ✓
Detection values match Splunk ✓
Indicators correspond with MISP ✓
The working pipeline demonstrated automatic TheHive case creation with the expected dynamic description, tags, severity, and five observables without manual case creation.
12. TheHive Integration Checkpoint
Before moving to MITRE ATT&CK Mapping, confirm:
TheHive is reachable over HTTPS ✓
API credentials remain outside source code ✓
HTTPS certificate validation is configured ✓
Automated case creation succeeds ✓
Case contains dynamic detection context ✓
Five observables are present ✓
Splunk and TheHive values are consistent ✓
MISP and TheHive represent the same detection ✓
At this point, a Splunk detection has progressed beyond alerting. The same structured detection data has been converted into threat intelligence in MISP and an investigation case in TheHive, providing both intelligence context and a case-management workflow for further analysis.
MITRE ATT&CK Mapping
MITRE ATT&CK adds behavioural context to the detection workflow. Indicators such as IP addresses, URLs, filenames, and ports describe what was observed, while ATT&CK helps describe what adversary behaviour the activity resembles.
MITRE ATT&CK is not a detection engine. The mapping should therefore be based on evidence from the lab rather than assigning techniques simply because they appear technically possible.
The mapping workflow used in this project is:
Splunk Detection
↓
Review Detection Evidence
↓
Identify Observed Behaviour
↓
Compare with MITRE ATT&CK
↓
Select Supported Technique
↓
Add TTP to TheHive Case
1. Review the Detection Behaviour
The controlled test generated the following behaviour:
Source endpoint: 192.168.95.134
Remote system: 192.168.95.135
Protocol: HTTP
Destination port: 8080
Retrieved file: test-file.txt
URL: http://192.168.95.135:8080/test-file.txt
The Windows endpoint retrieved a file from a separate controlled system. The Splunk detection captured the network activity, and the resulting values were passed into MISP and TheHive for investigation.
The relevant behaviour is therefore:
A file was transferred from a remote system into the endpoint environment.
2. Identify the ATT&CK Technique
The most appropriate ATT&CK mapping for this behaviour is:
|
ATT&CK field |
Mapping |
|
Domain |
Enterprise |
|
Tactic |
Command and Control |
|
Tactic ID |
TA0011 |
|
Technique |
Ingress Tool Transfer |
|
Technique ID |
T1105 |
MITRE describes Ingress Tool Transfer (T1105) as adversaries transferring tools or other files from an external system into a compromised environment. The technique applies to Windows and can involve file transfer through network protocols or web-based mechanisms.
For this lab, the mapping does not claim that test-file.txt is malware. It represents the behaviour being simulated: retrieval of a file from a controlled remote system.
3. Avoid Over-Mapping the Detection
ATT&CK techniques should only be assigned when the available evidence supports them. For example, this test uses HTTP, but that alone is not enough to classify the activity as:
T1071.001 – Application Layer Protocol: Web Protocols
That technique describes adversary command-and-control communication using web protocols. The current lab proves a file retrieval but does not establish an HTTP command-and-control channel.
For that reason, this project maps the activity to T1105 only.
This keeps the ATT&CK mapping evidence-based and avoids presenting assumptions as confirmed attacker behaviour.
4. Add the ATT&CK Technique to TheHive
TheHive 5 includes MITRE ATT&CK support directly in cases. By default, the Enterprise Attack catalogue contains the standard Enterprise ATT&CK techniques.
Open the automated case:
Suspicious Software Update Retrieval Validation – Automated Splunk Alert
Then select: TTPs
Your case currently shows: TTPs (0)
Select the option to add a TTP.
Configure:
Catalog:
Enterprise Attack
Tactic:
Command and Control
Technique:
T1105 – Ingress Tool Transfer
Occurrence date:
2026/08/19 : 18:34
For the procedure description, use:
The Windows endpoint retrieved test-file.txt from the controlled remote system at 192.168.95.135 over HTTP on TCP port 8080. The activity represents a controlled simulation of a file being transferred into an endpoint environment.
Then confirm the TTP.
TheHive requires the manageProcedure permission for an account to add or remove TTPs from a case.
5. Verify the TTP Mapping
Return to the TTPs tab.
The case should now show:
T1105
Ingress Tool Transfer
together with the associated ATT&CK catalogue and occurrence information.
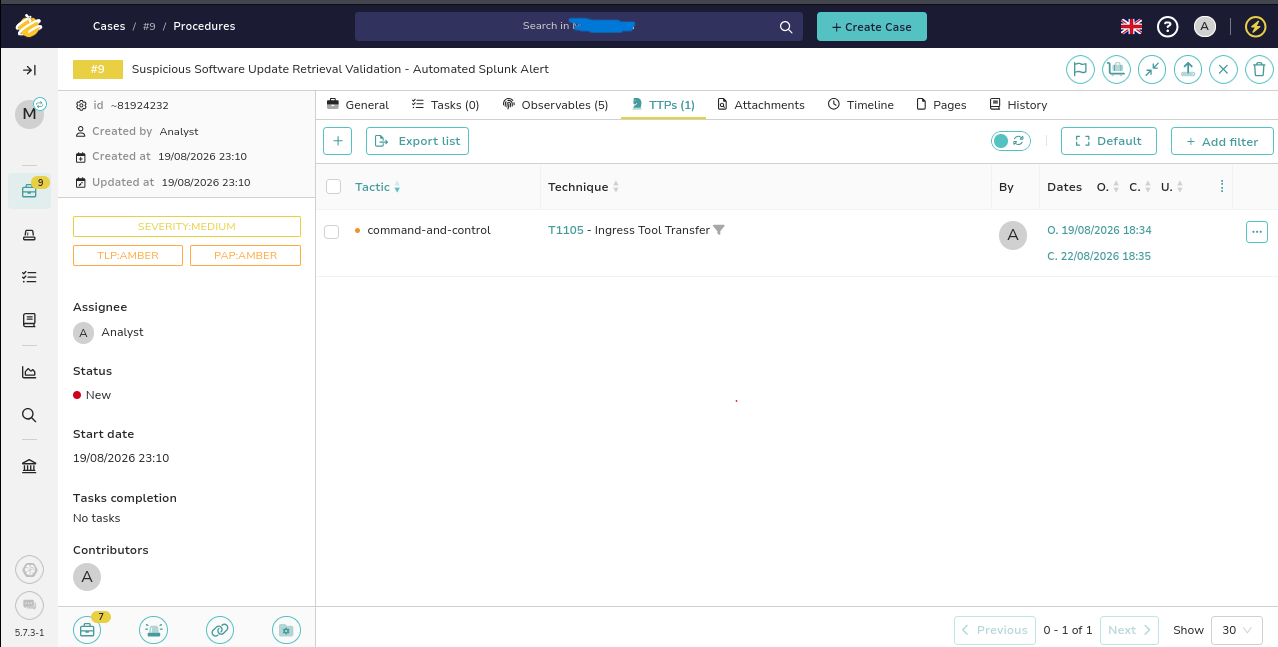
Figure 27. TheHive case mapped to MITRE ATT&CK technique T1105 – Ingress Tool Transfer under the Command and Control tactic.
The mapping connects the technical detection to a recognised adversary-behaviour framework without changing the original evidence stored in the case.
6. Understand the Relationship Between Indicators and ATT&CK
The project now contains two different types of investigation context:
Indicators
↓
192.168.95.134
192.168.95.135
test-file.txt
HTTP URL
TCP/8080
+
ATT&CK Behaviour
↓
TA0011 – Command and Control
T1105 – Ingress Tool Transfer
Indicators describe specific technical values observed during the test.
ATT&CK describes the behaviour those observations support.
This distinction is important because the same ATT&CK technique may involve many different IP addresses, domains, filenames, hashes, or tools across different investigations.
7. ATT&CK Mapping Checkpoint
Before moving to Testing the Complete Pipeline, confirm:
Detection evidence reviewed ✓
Observed behaviour identified ✓
ATT&CK technique selected from evidence ✓
T1105 – Ingress Tool Transfer mapped ✓
TA0011 – Command and Control identified ✓
TTP added to the TheHive case ✓
Unsupported techniques were not added ✓
At this point, the detection has progressed from a raw network event to a Splunk alert, structured threat-intelligence indicators, a TheHive investigation case, and an evidence-supported MITRE ATT&CK technique.
Testing the Complete Pipeline
The individual components have now been configured and tested separately. The final test validates that they work together as one automated workflow.
The goal is to generate one safe, controlled network event from the Windows endpoint and verify that the same detection progresses through Splunk, MISP, TheHive, and MITRE ATT&CK mapping.
The complete test path is:
Endpoint-01
192.168.95.134
↓
Controlled HTTP Request
↓
Kali
192.168.95.135:8080
↓
Windows Firewall Log
↓
Splunk
↓
Scheduled Detection
↓
cti_splunk_bridge.py
↓
cti_response.py
↓
MISP Event + Indicators
↓
TheHive Case + Observables
↓
MITRE ATT&CK T1105
1. Confirm the Lab is Ready
Before generating the final test event, confirm that the required systems are running and reachable:
|
Component |
Address |
Purpose |
|
MISP-01 |
192.168.95.131 |
Threat-intelligence storage |
|
TheHive-01 |
192.168.95.132 |
Investigation and case management |
|
Splunk-01 |
192.168.95.133 |
Detection and automation |
|
Endpoint-01 |
192.168.95.134 |
Windows test endpoint |
|
Kali |
192.168.95.135 |
Controlled remote test system |
Also confirm that:
Splunk receiving port 9997 is active
Windows Universal Forwarder is connected
The Splunk scheduled alert is enabled
MISP is reachable
TheHive is reachable
The protected API credentials are configured
Do not manually launch cti_response.py during this final test. The purpose is to prove that the scheduled Splunk alert starts the automation automatically.
2. Prepare the Safe Test File
On Kali: 192.168.95.135, create a dedicated test directory:
mkdir -p ~/cti-test
Create a harmless text file:
echo “Safe lab test file” > ~/cti-test/test-file.txt
Move into the directory:
cd ~/cti-test
Start a temporary HTTP server on TCP port 8080:
python3 -m http.server 8080
Leave this terminal open.
The server should display:
Serving HTTP on 0.0.0.0 port 8080
This server is used only inside the isolated lab to provide the controlled file used by the detection test.
3. Generate the Detection Event
On Endpoint-01 – Windows, open a browser and request:
http://192.168.95.135:8080/test-file.txt
The browser should display:
Safe lab test file
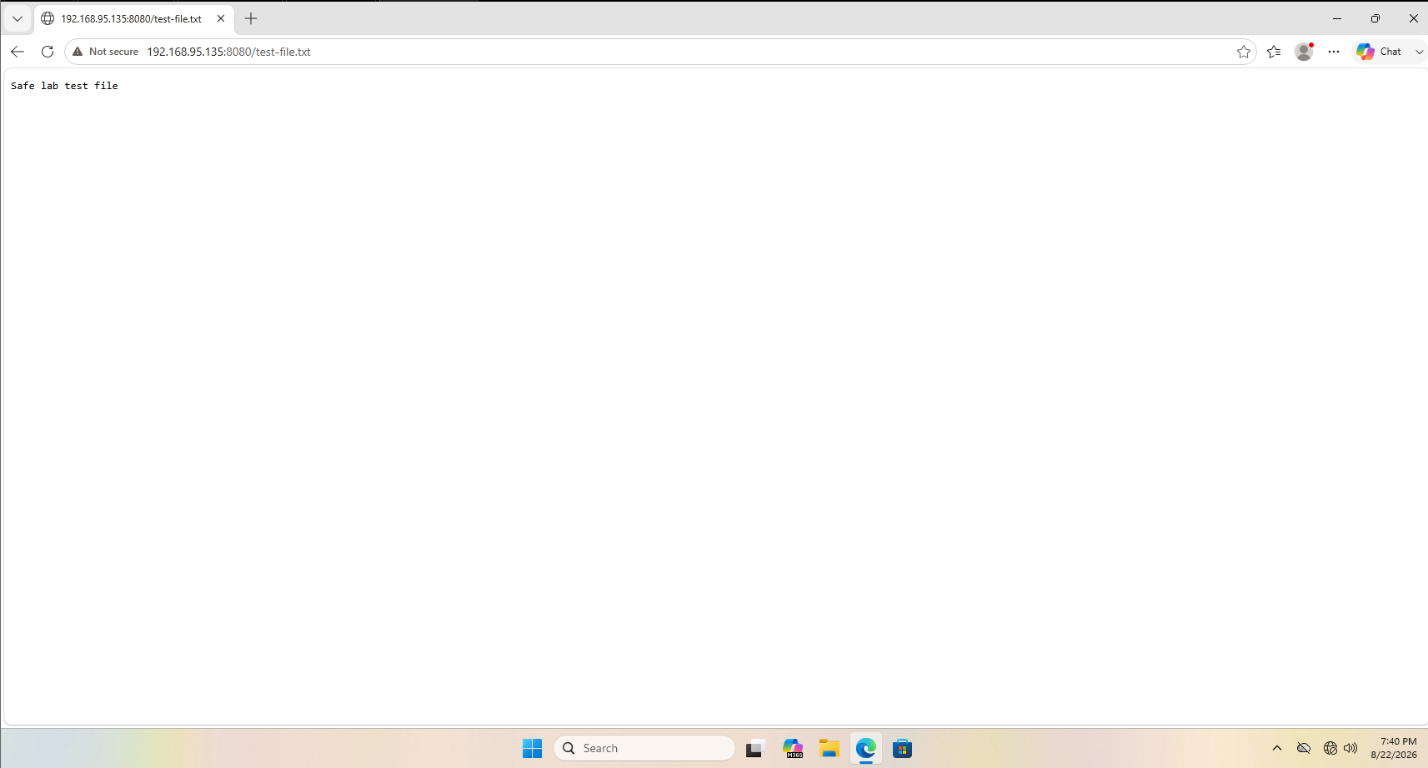
Figure 28. Endpoint-01 retrieving the safe test-file.txt file from the controlled Kali HTTP server.
This creates the network activity needed for the final detection test.
The expected values are:
|
Field |
Expected value |
|
Source IP |
192.168.95.134 |
|
Destination IP |
192.168.95.135 |
|
Destination port |
8080 |
|
URL |
http://192.168.95.135:8080/test-file.txt |
|
Filename |
test-file.txt |
4. Verify the Request on Kali
Return to the HTTP-server terminal on Kali.
A successful request should produce an entry similar to:
192.168.95.134 – – [date/time] “GET /test-file.txt HTTP/1.1” 200 –
The important values are:
192.168.95.134
GET /test-file.txt
HTTP response 200
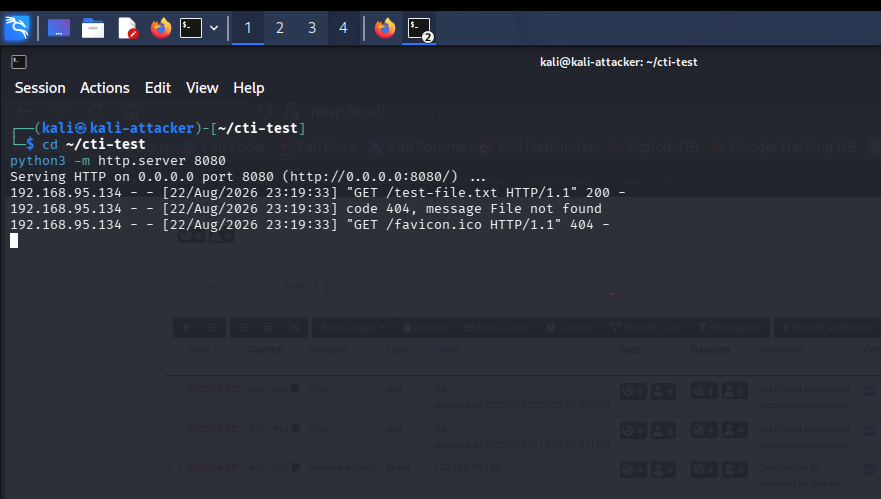
Figure 29. Kali HTTP server receiving the controlled test-file.txt request from Endpoint-01 at 192.168.95.134.
For a clean screenshot, restart the HTTP server if necessary and generate one fresh request so the terminal is not filled with unrelated older requests.
5. Verify the Event in Splunk
Open Splunk:
Search for the fresh traffic:
index=main sourcetype=pfirewall-2 “192.168.95.135” “8080” earliest=-15m
The saved detection later normalises this activity into:
alert_name
source_ip
destination_ip
destination_port
url
filename
The alert name used by this project is:
Suspicious Software Update Retrieval Validation
Do not manually run the response script at this stage.
6. Allow the Scheduled Alert to Run
The alert is configured to execute every five minutes:
*/5 * * * *
After generating the fresh request, wait for the next scheduled execution.
The workflow should occur automatically:
Splunk scheduled search
↓
Detection result
↓
cti_splunk_bridge.py
↓
results.csv.gz parsed
↓
cti_response.py
The scheduled Splunk alert launches the protected response script automatically rather than requiring an analyst to run it manually.
7. Verify the Automation Logs
On Splunk-01, check:
echo “=== CTI BRIDGE LOG ===”
sudo tail -5 /opt/splunk/var/log/splunk/cti_bridge.log
echo
echo “=== CTI RESPONSE LOG ===”
sudo tail -5 /opt/splunk/var/log/splunk/cti_response.log
The newest entries should contain the current alert and indicators.
Look for:
Launching CTI response:
alert=Suspicious Software Update Retrieval Validation
CTI response completed with exit code 0
CTI workflow started:
alert=Suspicious Software Update Retrieval Validation
Indicators received:
source=192.168.95.134
destination=192.168.95.135
port=8080
url=http://192.168.95.135:8080/test-file.txt
filename=test-file.txt
CTI workflow completed successfully
8. Verify the MISP Result
Open MISP:
Go to:
Event Actions → List Events
Locate:
Suspicious Software Update Retrieval Validation – Automated Splunk Detection
The response script searches for this event before creating a new one. If it already exists, the script reuses it and records another detection occurrence instead of intentionally creating another MISP event.
Open the event and confirm the following attributes:
ip-src 192.168.95.134
ip-dst 192.168.95.135
url http://192.168.95.135:8080/test-file.txt
filename test-file.txt
port 8080
These are the five values the response script sends to MISP.
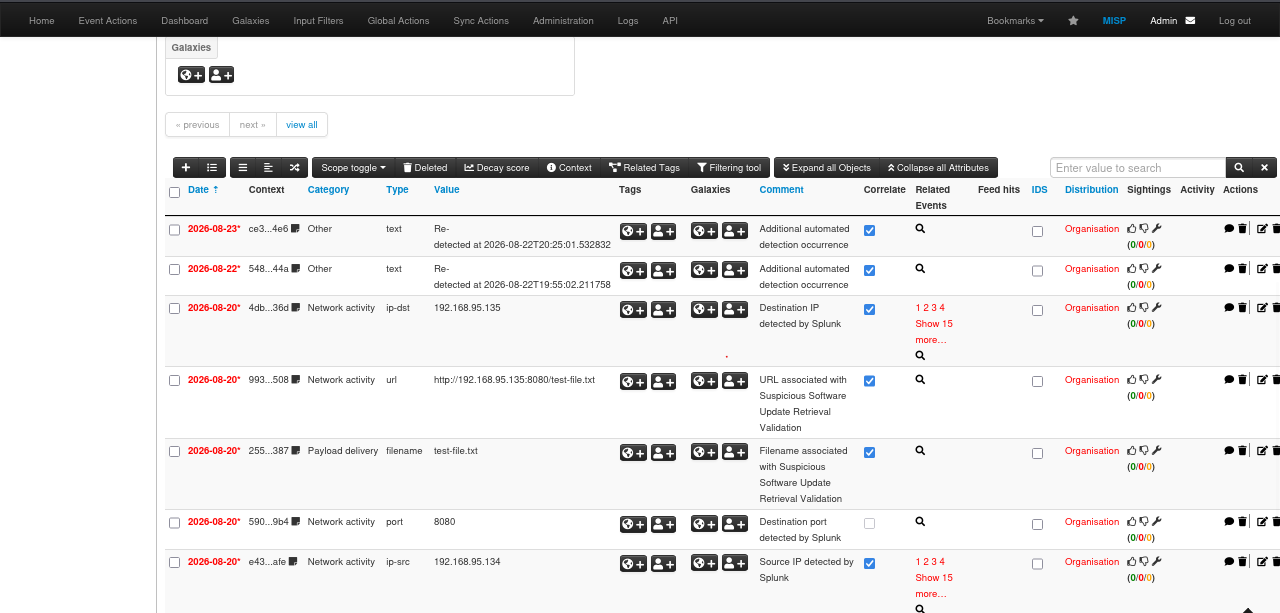
Figure 30. MISP event automatically updated by the Splunk response workflow, showing five detection attributes and subsequent re-detection timestamps.
This is an important screenshot because the earlier MISP figures demonstrated OTX and VirusTotal enrichment, while Figure 30 proves that the Splunk automation itself writes the final detection values into MISP.
9. Verify the TheHive Result
Open:
Go to Cases.
The automated workflow should create a case titled:
Suspicious Software Update Retrieval Validation – Automated Splunk Alert
Verify that the case description includes:
192.168.95.134
192.168.95.135
8080
http://192.168.95.135:8080/test-file.txt
test-file.txt
Then open Observables and confirm that five observables are present.
The automation creates the case and adds the source IP, destination IP, URL, filename, and TCP/8080 as individual observables.
10. Verify the ATT&CK Mapping
Inside the same TheHive case, open:
TTPs
Confirm:
Tactic:
Command and Control
Technique:
T1105 – Ingress Tool Transfer
This was demonstrated in Figure 27, so another screenshot is unnecessary.
Remember that the TTP mapping is an analyst classification added after reviewing the evidence; the Splunk response script itself does not automatically assign T1105 in the current implementation.
11. Validate the Complete Chain
Compare the values across the systems.
|
Stage |
Expected evidence |
|
Endpoint |
Requests test-file.txt |
|
Kali |
Receives GET from 192.168.95.134 |
|
Splunk |
Detects .134 → .135:8080 |
|
Bridge |
Receives and parses the Splunk result |
|
Response script |
Processes all six normalized fields |
|
MISP |
Stores five detection indicators |
|
TheHive |
Creates the investigation case |
|
TheHive Observables |
Stores five observables |
|
MITRE ATT&CK |
Case mapped to T1105 |
The important result is not that each platform works individually. The test demonstrates that one controlled endpoint action can move through the detection, automation, intelligence, and investigation layers without manually reconstructing the alert in each tool. This validates automatic Splunk execution, MISP creation/update, and TheHive case creation with five observables.
12. Understand Repeat-Test Behaviour
If the test is performed again, MISP may find the existing event rather than creating another one.
The automation adds a new detection-occurrence note when it reuses an existing event. Duplicate attributes may also be rejected as duplicates rather than added again. A duplicate response should therefore not automatically be interpreted as an authentication failure.
TheHive may create another case when the scheduled detection triggers again because case creation is a separate response action.
13. Complete Pipeline Checkpoint
Before considering the final test successful, confirm:
Safe HTTP test file served from Kali ✓
Endpoint-01 generated the controlled request ✓
Kali received the request from 192.168.95.134 ✓
Windows firewall activity reached Splunk ✓
Scheduled Splunk detection triggered ✓
Bridge script launched automatically ✓
Response script exited successfully ✓
MISP event was created or reused ✓
Five MISP detection attributes are present ✓
TheHive case was created automatically ✓
Five TheHive observables are present ✓
ATT&CK T1105 mapping is attached ✓
No API keys or credentials were exposed ✓
At this point, the complete lab pipeline has been validated:
Endpoint
↓
Splunk Detection
↓
Automated Response
↓
MISP Intelligence
↓
TheHive Investigation
↓
MITRE ATT&CK Context
Expected Results
After the lab is configured correctly, one controlled request from Endpoint-01 should move through the detection and response workflow without manually reconstructing the event in each platform.
The expected result is:
Endpoint-01
192.168.95.134
↓
Controlled request to Kali
192.168.95.135:8080
↓
Windows Firewall telemetry
↓
Splunk detection
↓
Normalized detection fields
↓
Scheduled automation
↓
MISP event / indicators
↓
TheHive case / observables
↓
Analyst MITRE ATT&CK mapping
1. Endpoint and Network Result
When Endpoint-01 requests:
http://192.168.95.135:8080/test-file.txt
the browser should display:
Safe lab test file
The Kali HTTP server should record a successful request similar to:
192.168.95.134 – – [date/time] “GET /test-file.txt HTTP/1.1” 200 –
This confirms that the controlled network activity occurred between:
Source: 192.168.95.134
Destination: 192.168.95.135
Port: 8080
Protocol: TCP
Figures 28 and 29 demonstrate this stage of the workflow.
2. Splunk Detection Result
The Windows Firewall activity should reach Splunk through the Universal Forwarder and appear in:
index=main
The detection logic should identify the connection to:
192.168.95.135:8080
and produce the normalized fields required by the automation:
|
Field |
Expected value |
|
alert_name |
Suspicious Software Update Retrieval Validation |
|
source_ip |
192.168.95.134 |
|
destination_ip |
192.168.95.135 |
|
destination_port |
8080 |
|
url |
http://192.168.95.135:8080/test-file.txt |
|
filename |
test-file.txt |
The scheduled alert should then pass the normalized result to the bridge through Splunk’s results.csv.gz output.
3. Automation Result
The bridge should read the Splunk result, validate the required fields, and launch:
cti_response.py
with the detection values supplied dynamically.
The bridge log should contain an entry similar to:
Launching CTI response:
alert=Suspicious Software Update Retrieval Validation,
source=192.168.95.134,
destination=192.168.95.135,
port=8080,
filename=test-file.txt
A successful execution should end with:
CTI response completed with exit code 0
The response log should also show that the workflow received the expected indicators.
The automation section explains that Splunk provides these normalized fields through results.csv.gz before the bridge launches the response script.
4. MISP Result
MISP should contain an event named:
Suspicious Software Update Retrieval Validation – Automated Splunk Detection
The event should contain these five detection attributes:
|
Attribute type |
Value |
|
ip-src |
192.168.95.134 |
|
ip-dst |
192.168.95.135 |
|
url |
http://192.168.95.135:8080/test-file.txt |
|
filename |
test-file.txt |
|
port |
8080 |
If the same detection runs again, the automation should search for the existing event first rather than intentionally creating another identical event.
When the event is reused, an additional occurrence may be recorded as:
Re-detected at <timestamp>
The response script is designed to search for the existing event and reuse it before creating a new one.
Figure 30 demonstrates the resulting MISP event with the five detection attributes and subsequent re-detection records.
5. TheHive Result
The automation should create a TheHive case titled:
Suspicious Software Update Retrieval Validation – Automated Splunk Alert
The case should include the detected network context and contain five observables:
192.168.95.134
192.168.95.135
http://192.168.95.135:8080/test-file.txt
test-file.txt
TCP/8080
The response script creates the case and adds the source IP, destination IP, URL, filename, and detected port as separate observables.
The earlier TheHive workflow figures demonstrate the resulting case and observable records.
6. MITRE ATT&CK Result
After reviewing the available evidence, the analyst should be able to associate the controlled file-transfer behaviour with:
Domain: Enterprise
Tactic: Command and Control
Tactic ID: TA0011
Technique: Ingress Tool Transfer
Technique ID: T1105
The ATT&CK mapping is analyst-applied context, not an automatic output of the response script.
The expected TheHive TTP record therefore shows:
Command and Control
T1105 – Ingress Tool Transfer
as demonstrated earlier in Figure 27.
7. Expected End-to-End Outcome
The lab shows that each platform has a distinct responsibility:
|
Layer |
Expected result |
|
Endpoint |
Generates controlled activity |
|
Windows Firewall |
Records the network connection |
|
Splunk |
Detects and normalizes the event |
|
Bridge |
Reads and validates the Splunk result |
|
Response script |
Processes the detection dynamically |
|
MISP |
Stores or updates detection indicators |
|
TheHive |
Creates an investigation case and observables |
|
MITRE ATT&CK |
Provides analyst-applied behavioural context |
The key result is not simply that each tool is running. The lab demonstrates that structured security data can move from endpoint telemetry into detection, threat-intelligence management, and investigation with minimal manual handling.
8. Successful Result Checkpoint
A successful build should produce:
Endpoint request completed ✓
Kali HTTP request recorded ✓
Windows Firewall telemetry reached Splunk ✓
Splunk detection returned normalized fields ✓
Scheduled alert launched automatically ✓
Bridge processed results.csv.gz ✓
Response script received dynamic values ✓
MISP event was created or reused ✓
Five MISP detection attributes are present ✓
TheHive case was created ✓
Five TheHive observables are present ✓
Observed behaviour was mapped to ATT&CK T1105 ✓
API credentials remained protected ✓
When these results are present, the lab has achieved its intended outcome: a controlled endpoint event can be detected, normalized, transferred into the intelligence layer, converted into an investigation record, and given evidence-supported MITRE ATT&CK context.
Troubleshooting
A multi-platform security lab can fail at several points even when each individual component appears to be configured correctly. The fastest way to troubleshoot this environment is to test the pipeline one stage at a time rather than changing multiple components at once.
Use the same order as the data flow:
Network
↓
Endpoint Telemetry
↓
Splunk Ingestion
↓
Detection Logic
↓
Bridge Script
↓
Response Script
↓
MISP / TheHive
If one stage fails, verify that stage before moving farther down the pipeline.
1. Lab Systems Cannot Reach Each Other
First verify that every machine still has its expected private address:
MISP-01 192.168.95.131
TheHive-01 192.168.95.132
Splunk-01 192.168.95.133
Endpoint-01 192.168.95.134
Kali 192.168.95.135
On a Linux VM, check the current addresses with:
ip addr
Then test communication between the systems.
For example, from Splunk-01:
ping -c 3 192.168.95.131
ping -c 3 192.168.95.132
ping -c 3 192.168.95.135
If communication fails, verify that:
- the VM is connected to the correct VMware Host-only network;
- the expected static IP is still assigned;
- the subnet remains 192.168.95.0/24;
- and no VM was accidentally moved to NAT-only or Bridged networking.
MISP-01 may also have a NAT adapter for external intelligence access, but its Host-only adapter must remain available at 192.168.95.131. Your threat-intelligence section already relies on keeping both interfaces active.
2. Splunk Web Does Not Open
This lab uses Splunk Web over HTTPS:
On Splunk-01, first confirm that Splunk is running:
sudo /opt/splunk/bin/splunk status
If necessary:
sudo /opt/splunk/bin/splunk start
You can also verify the local HTTPS service:
curl -k -I https://127.0.0.1:8000
A self-signed certificate warning is normal inside this isolated lab.
Do not assume the service is unavailable simply because plain HTTP does not respond after HTTPS has been enabled.
3. Splunk Receiver Port 9997 Is Not Listening
On Splunk-01, run:
sudo ss -ltnp | grep 9997
A working receiver should show TCP port 9997 listening.
If nothing appears, inspect Splunk’s effective input configuration:
sudo /opt/splunk/bin/splunk btool inputs list –debug
Look for:
[splunktcp://9997]
disabled = 0
Restart Splunk after correcting the receiver configuration:
sudo /opt/splunk/bin/splunk restart
Then check again:
sudo ss -ltnp | grep 9997
This is important because a receiver can appear configured in Splunk while the operating system is not actually listening on the port.
4. Universal Forwarder Is Running but No Events Reach Splunk
On Endpoint-01, open PowerShell as Administrator and check the service:
Get-Service SplunkForwarder
It should show:
Status: Running
Then check the forwarding destination:
& “C:\Program Files\SplunkUniversalForwarder\bin\splunk.exe” list forward-server
The active destination should include:
192.168.95.133:9997
If it does not, verify the receiver configuration and restart the Universal Forwarder.
Your Splunk setup specifically uses Endpoint-01 → Universal Forwarder → 192.168.95.133:9997 → Splunk.
Finally, search in Splunk:
index=main earliest=-15m
If the forwarder is running but no data appears, verify port 9997 on Splunk before reinstalling the forwarder.
5. Windows Firewall Events Do Not Appear
Confirm that Windows Firewall logging is enabled for successful connections and that the log exists at:
C:\Windows\System32\LogFiles\Firewall\pfirewall.log
Then confirm that the Universal Forwarder monitors that file.
Once the test request has been generated, search:
index=main sourcetype=pfirewall-2 “192.168.95.135” “8080” earliest=-15m
If this returns no results, troubleshoot the data source before changing the detection SPL.
Also verify that the Kali HTTP server actually received the request from:
192.168.95.134
A successful request should resemble:
“GET /test-file.txt HTTP/1.1” 200
The final test in this guide uses exactly this traffic as the input to the Splunk detection.
6. Detection Search Finds Traffic but Normalized Fields Are Missing
The automation requires:
alert_name
source_ip
destination_ip
destination_port
url
filename
If one or more fields are missing, run the complete detection search manually and inspect the Statistics view.
The end of the search must return the normalized fields:
| table _time host action protocol source_ip destination_ip source_port destination_port alert_name url filename
| head 1
Remember that the firewall log provides the network values, while the controlled lab adds:
alert_name
url
filename
through the detection logic.
If these fields are not returned by Splunk, the bridge cannot pass them to the response script. The existing automation explicitly depends on all six normalized values.
7. Bridge Reports “No Splunk Results File Was Received”
Splunk scripted alerts provide the search output through a compressed file:
results.csv.gz
Do not assume that the results file will always occupy one fixed command-line argument position.
The bridge should first check the Splunk environment value and then search the supplied arguments for the results file:
results_file = os.environ.get(“SPLUNK_ARG_8”)
if not results_file:
for argument in reversed(sys.argv[1:]):
if argument.endswith(“results.csv.gz”):
results_file = argument
break
if not results_file:
write_log(“ERROR”, “No Splunk results file was received”)
return 2
This is more reliable than depending only on:
sys.argv[8]
After a scheduled alert runs, inspect:
sudo tail -20 /opt/splunk/var/log/splunk/cti_bridge.log
8. Bridge Reports Missing Required Fields
If the bridge finds results.csv.gz but reports:
Missing required fields
the problem is usually the Splunk search output rather than the Python response script.
Run the detection manually and confirm that all six required fields contain values:
alert_name
source_ip
destination_ip
destination_port
url
filename
Do not proceed until the normalized result is correct.
This is why the detection logic deliberately uses rex, eval, and table before the result reaches the bridge.
9. Response Script Fails
Check the response log on Splunk-01:
sudo tail -20 /opt/splunk/var/log/splunk/cti_response.log
Before testing the APIs, validate the script itself:
sudo /usr/bin/python3 -m py_compile /opt/splunk/bin/scripts/cti_response.py
No output indicates that Python successfully parsed the script.
Then use the script’s –dry-run mode to test the supplied fields without contacting MISP or TheHive.
A valid dry run should return:
echo $?
0
The guide already uses dry-run validation specifically so input problems can be separated from downstream API problems.
10. MISP Is Reachable, but No New Event Appears
Do not immediately treat this as a failure.
The response script first searches for:
Suspicious Software Update Retrieval Validation – Automated Splunk Detection
If that event already exists, it is intentionally reused.
A repeat detection may instead add:
Re-detected at <timestamp>
to the existing event.
Therefore, check the existing event and its attributes before expecting another event to appear.
The final pipeline test explicitly uses this event-reuse behaviour, and duplicate attributes may also be rejected rather than stored again.
11. VirusTotal Returns 404
A VirusTotal 404 does not necessarily mean that authentication or networking failed.
A newly created or custom file may simply have no existing VirusTotal record.
For a predictable enrichment test, use the standard EICAR test-file hash used earlier in this guide rather than uploading or introducing real malware.
Your intelligence section already notes that a custom test file may return 404, while the known EICAR hash provides a safe reproducible test.
12. MISP Cannot Reach OTX or VirusTotal
On MISP-01, verify DNS:
getent hosts otx.alienvault.com
Then test outbound HTTPS:
curl -I https://otx.alienvault.com
curl -I https://www.virustotal.com
If external access fails, inspect:
ip addr
ip route
MISP-01 should retain:
Host-only: 192.168.95.131
while also having a NAT-connected interface with a default route for outbound Internet access.
Do not remove the Host-only interface to fix Internet connectivity.
13. TheHive Case Is Not Created
First verify that TheHive is reachable from Splunk-01:
https://192.168.95.132
Then confirm that:
- the TheHive API key in /opt/splunk/etc/cti_secrets.conf is valid;
- the public TheHive certificate exists on Splunk-01;
- the certificate path configured in the response script is correct;
- and the API account has permission to create cases and observables.
Verify the certificate:
ls -l /opt/splunk/etc/certs/thehive.crt
The response script is configured to use the public certificate when connecting to TheHive. Your automation section intentionally copies only the public certificate to Splunk-01, not the private key.
14. Logs Show Success but a Downstream Result Is Missing
Do not use one message such as:
CTI workflow completed successfully
or an exit code of 0 as the only proof that every downstream action succeeded.
Verify the actual result in each platform:
Splunk result ✓
Bridge log ✓
Response log ✓
MISP event ✓
MISP attributes ✓
TheHive case ✓
TheHive observables ✓
This is especially important when troubleshooting API failures. A log proves that code execution reached a particular point; the MISP and TheHive interfaces prove that the expected records were actually created or updated.
15. ATT&CK T1105 Does Not Appear Automatically
This is expected.
The current response script does not automatically assign MITRE ATT&CK techniques.
After reviewing the observed behaviour, the analyst manually maps:
Tactic: Command and Control
Technique: T1105 – Ingress Tool Transfer
The guide deliberately keeps the ATT&CK classification analyst-driven rather than automatically assigning a technique from a single network event.
Troubleshooting Checkpoint
When diagnosing a failed pipeline, verify the stages in this order:
Private network connectivity ✓
Required services are running ✓
Splunk TCP 9997 is listening ✓
Universal Forwarder is connected ✓
Windows telemetry reaches index=main ✓
Controlled firewall event appears ✓
Detection returns all normalized fields ✓
results.csv.gz reaches the bridge ✓
Bridge launches the response script ✓
Response inputs validate successfully ✓
MISP API operation is verified ✓
TheHive API operation is verified ✓
ATT&CK mapping is reviewed separately ✓
Testing the pipeline in this order helps isolate the failing component instead of rebuilding or reconfiguring parts of the lab that are already working.
What I Learned
Building this lab changed how I think about security tools. Installing Splunk, MISP, or TheHive individually is useful, but the harder and more valuable part is making those tools exchange the right information at the right time.
The biggest lesson from this project was that a detection pipeline is not one application. It is a chain of systems, data formats, network connections, APIs, scripts, and decisions. A problem in any one of those areas can stop the entire workflow.
1. Collecting Logs Is Not the Same as Building a Detection
Getting Windows events into Splunk was only the first step.
The raw Windows Firewall telemetry contained useful network information, but the automation needed a predictable structure:
alert_name
source_ip
destination_ip
destination_port
url
filename
This showed me why normalization matters.
Instead of making the response script understand the original firewall-log format, Splunk extracts the relevant values and returns a clean interface for the next component.
The resulting design became:
Raw Telemetry
↓
Detection Logic
↓
Normalized Fields
↓
Automation
That separation made the workflow easier to understand and troubleshoot.
2. Integration Is Often Harder Than Installing the Tools
Each platform had a different responsibility:
Splunk → Detection
MISP → Threat-intelligence management
TheHive → Investigation
Python → Integration and automation
The difficult part was not understanding what each platform did individually. It was handling the boundaries between them.
Those boundaries included:
- network connectivity;
- API authentication;
- certificates;
- JSON requests and responses;
- Splunk result formats;
- field names;
- permissions;
- and error handling.
This reinforced that security-tool integration is as much about understanding how systems communicate as it is about knowing the individual security products.
3. A Small Data-Format Problem Can Break the Whole Pipeline
One of the most useful lessons came from Splunk’s scripted-alert output.
The automation expected structured fields, but Splunk passes scheduled-search results through:
results.csv.gz
That meant the detection search had to explicitly return the fields required by the bridge.
It also meant that the bridge had to correctly locate, decompress, read, and validate the result before launching the response script.
A small mismatch in a field name or result format could prevent everything downstream from working even though Splunk itself was functioning correctly.
This made me appreciate the importance of defining a clear interface between components.
4. Automation Needs Validation, Not Just Execution
Another important lesson was that a script running successfully does not automatically prove that every downstream action succeeded.
For this project, I learned to verify the workflow at multiple levels:
Did Splunk trigger?
↓
Did the bridge receive the result?
↓
Did the response script receive the correct values?
↓
Did MISP actually contain the indicators?
↓
Did TheHive actually contain the case and observables?
Logs are useful for understanding execution, but the actual records inside MISP and TheHive provide stronger evidence that the expected operation occurred.
Adding input validation, dedicated logs, exit codes, and a dry-run mode also made the automation much easier to test safely.
5. Troubleshooting Works Better from the Beginning of the Pipeline
When several systems are connected, it is tempting to troubleshoot the component where the final error becomes visible.
This lab taught me to work in the opposite direction.
For example, if no TheHive case appears, the problem may not be TheHive. The failure could have started earlier because:
Firewall telemetry was missing
↓
Splunk returned no detection
↓
Required fields were missing
↓
Bridge could not process the result
↓
Response script was never launched
Testing each stage independently made faults much easier to isolate.
The approach that worked best was:
Network
↓
Telemetry
↓
Detection
↓
Automation
↓
API
↓
Destination Platform
This became one of the most practical lessons from the project.
6. Secrets and Certificates Are Part of the Architecture
API integration also made credential handling an important part of the design.
Rather than storing MISP and TheHive API keys directly inside the Python script, the lab keeps them in a protected configuration file.
TheHive certificate validation also required the response system to have the appropriate public certificate without exposing the server’s private key.
This showed me that secure integration is not only about getting an API request to work. Authentication material, file permissions, certificate handling, and what appears in screenshots or source code all need to be considered as part of the system.
7. Repeated Detections Need to Be Handled Deliberately
Another useful lesson came from running the same controlled test more than once.
Simply creating a new MISP event every time would produce unnecessary duplicates. Instead, the response workflow searches for the existing event and can reuse it while recording a new detection occurrence.
This introduced an important automation concept: repeated execution should have predictable behaviour.
The same input should not create uncontrolled duplication simply because a scheduled detection runs again.
It also showed why duplicate responses from an API are not automatically errors. Sometimes they indicate that the expected information already exists.
8. MITRE ATT&CK Mapping Should Follow the Evidence
Working with MITRE ATT&CK also reinforced that technique mapping should not be treated as a label that is automatically added to every alert.
For this detection, the observed behaviour supports:
Tactic:
Command and Control
Technique:
T1105 – Ingress Tool Transfer
I deliberately kept this classification analyst-driven.
The response script moves the technical evidence into TheHive, but the ATT&CK mapping is applied after reviewing what the evidence actually demonstrates.
This helped separate two different concepts:
Automation → moves and organizes evidence
Analyst reasoning → interprets the behaviour
That distinction is important because an IP address, port, protocol, or filename alone does not prove an ATT&CK technique.
9. The Value Is in the Connected System
The main takeaway from this project is that the most interesting part begins after the SIEM generates an alert.
The lab started with a simple controlled request, but that event eventually moved through endpoint telemetry, Splunk detection, structured automation, MISP intelligence, TheHive investigation, and MITRE ATT&CK context.
Building that connection helped me understand how individual security functions can become part of a larger detection and investigation process.
More importantly, I learned that building a useful security workflow requires more than knowing individual tools. It requires understanding the data moving between them, designing clear interfaces, protecting credentials, validating automation, and troubleshooting the system as one connected pipeline.
This ties back to my original goal for the project: not just installing security tools, but understanding what happens after the SIEM generates an alert and how the different parts of the workflow connect.
Limitations
This project demonstrates how detection, threat intelligence, automation, investigation, and MITRE ATT&CK context can be connected in a small lab environment. It is intentionally designed for learning and reproducibility rather than production deployment.
Several limitations should be considered when interpreting the results or extending the design.
1. This Is a Learning Environment, Not a Production SOC
The architecture runs on a small set of virtual machines inside an isolated home-lab network.
It does not include many capabilities that would normally be expected in a production security environment, such as:
- high availability and redundancy;
- centralized identity and access management;
- large-scale log retention;
- production certificate management;
- backup and disaster-recovery processes;
- enterprise network segmentation;
- performance monitoring;
- or large-scale endpoint coverage.
The project documentation already defines the environment as intentionally simplified rather than a production SOC.
The goal is therefore to demonstrate the workflow and integration concepts, not to reproduce a complete enterprise security architecture.
2. The Detection Is Built Around One Controlled Scenario
The Splunk detection looks for a specific controlled connection:
Endpoint-01
192.168.95.134
↓
Kali
192.168.95.135:8080
This makes the behaviour easy to reproduce and validate, but it also means the detection is not a general-purpose malicious-file detection rule.
The current test proves that Splunk can identify the controlled network activity and move the resulting context into the response pipeline. The same detection logic would need to be redesigned for broader production telemetry, changing systems, multiple destinations, or different network behaviours.
3. Some Detection Context Is Constructed Rather Than Directly Observed
The Windows Firewall telemetry provides network-layer information such as:
source_ip
destination_ip
source_port
destination_port
protocol
action
However, the current firewall log does not provide the complete HTTP URL or requested filename.
For this controlled test, the detection logic constructs:
url
filename
alert_name
because the requested resource is already known.
This is appropriate for a reproducible lab, but a broader detection system should obtain application-level evidence from telemetry capable of observing the actual request rather than assuming the URL or filename from the test scenario.
4. Threat-Intelligence Enrichment Is Not Fully Joined to the Automated Detection Path
The project demonstrates OTX ingestion, VirusTotal hash lookups, and MISP intelligence management. However, the automated Splunk response path currently receives these six normalized fields:
alert_name
source_ip
destination_ip
destination_port
url
filename
The response script then creates or updates MISP intelligence and creates the corresponding TheHive case.
The current automated path does not calculate the downloaded file’s hash and automatically send that hash through VirusTotal or OTX before creating the investigation record.
This means the project demonstrates both intelligence enrichment and automated detection response, but those capabilities are not yet combined into one fully dynamic enrichment decision.
That is an important distinction because the project overview describes enrichment as part of the wider architecture, while the tested automated response is currently driven by the normalized network and file-context fields.
5. The Scheduled Detection Processes One Result
The detection finishes with:
| head 1
This is useful for the controlled lab because one structured result is passed into the automation during each test.
It would not be appropriate for a higher-volume environment.
If several different matching events occurred within the same search window, head 1 would return only one of them to the response workflow.
A larger implementation would need to process multiple results safely, preserve event identity, and prevent one detection from hiding another.
6. Repeat Detections Are Only Partially Deduplicated
MISP handles repeated detections reasonably well in the current implementation.
Before creating a new event, the script searches for the existing event. If one is found, it reuses the event and records another detection occurrence instead of intentionally creating another identical MISP event.
TheHive behaves differently.
A repeated scheduled detection may create another TheHive case because case creation is a separate response action.
A more mature implementation would include case-correlation or deduplication logic such as:
Detection received
↓
Search for existing open case
↓
Existing case?
↙ ↘
Yes No
↓ ↓
Update Create
existing new case
case
This would reduce unnecessary case creation when the same activity is detected repeatedly.
7. Downstream API Success Is Not Enforced Strictly Enough
The current response script attempts the MISP operation and then the TheHive operation.
For example, the script only adds MISP attributes when an event_id is returned and only adds TheHive observables when a case_id is returned. It then reaches the workflow-completion log at the end of the function.
Because of this structure, a failure in one downstream operation may not always cause the complete response process to stop with a non-zero exit status.
This is why the project verifies the actual records in MISP and TheHive instead of treating:
CTI workflow completed successfully
Or:
exit code 0
as the only evidence of success.
A stronger implementation should use stage-specific error handling:
MISP request
↓
Succeeded?
↙ ↘
Yes No → Log failure → Return non-zero
↓
TheHive request
↓
Succeeded?
↙ ↘
Yes No → Log failure → Return non-zero
↓
Workflow success
This would make automation status more accurately represent downstream API results.
8. Certificate Handling Is Suitable for the Lab, Not Production
The environment uses self-signed certificates for local services.
TheHive certificate verification is handled by copying its public certificate to Splunk-01, but the MISP API code used in the isolated lab disables certificate verification for the local MISP connection.
That simplifies a private learning environment, but disabling TLS verification would not be appropriate for a production integration.
A production design should use trusted certificates and validate every HTTPS connection.
9. MITRE ATT&CK Mapping Is Analyst-Driven
The response script does not automatically assign:
T1105 – Ingress Tool Transfer
The technique is added after reviewing the observed behaviour.
This is intentional.
MITRE ATT&CK is not a detection engine, and the project avoids assigning techniques simply because they are technically possible. The guide specifically avoids adding T1071.001 merely because HTTP was used, because the evidence does not establish an HTTP command-and-control channel.
The limitation is that ATT&CK context currently requires analyst action.
A future implementation could suggest possible ATT&CK techniques automatically, but an analyst should still validate the mapping before treating it as confirmed.
10. External Intelligence Depends on Third-Party Services
OTX and VirusTotal are external services.
Their availability, API behaviour, authentication requirements, rate limits, and returned intelligence are outside the control of the lab.
MISP-01 also requires a separate NAT interface to reach those services while retaining its Host-only connection to the private lab.
As a result, an external service failure does not necessarily indicate a problem with the internal Splunk, MISP, or TheHive pipeline.
11. Platform and API Versions May Change
The project integrates several independently maintained platforms:
Splunk
MISP
TheHive
OTX
VirusTotal
Python
MITRE ATT&CK
Their interfaces and APIs can change over time.
An endpoint, authentication method, script action, package version, or API response that works with the versions used in this lab may require modification after a platform upgrade.
For this reason, the project records the versions used during the build and treats the integration code as a reproducible implementation rather than a permanently version-independent solution.
Limitations Summary
The main limitations of the current implementation are:
|
Area |
Current limitation |
|
Environment |
Small educational lab rather than production infrastructure |
|
Detection |
Built around one controlled network scenario |
|
Telemetry |
URL and filename are constructed from known test context |
|
Enrichment |
VirusTotal/OTX enrichment is not fully joined to the automated Splunk response |
|
Alert processing |
One result is passed using head 1 |
|
Deduplication |
MISP reuse exists, but TheHive can create repeat cases |
|
Error handling |
Downstream API failures are not always enforced as workflow failures |
|
TLS |
Some local certificate handling is lab-specific |
|
ATT&CK |
Technique mapping requires analyst review |
|
External APIs |
Dependent on third-party availability and limits |
|
Compatibility |
Platform/API changes may require code updates |
These limitations do not prevent the lab from demonstrating its intended architecture. They define the boundary between the current learning implementation and the more resilient, scalable, and evidence-rich design that could be built from it.
Next Improvements
The current lab proves that endpoint telemetry can move through detection, automation, threat-intelligence management, and investigation as one connected workflow. The next stage would be to make that workflow more dynamic, resilient, and capable of handling a wider range of security events.
The following improvements would be the most useful extensions to the current design.
1. Add Automatic File-Hash Collection and Enrichment
The most important improvement would be to connect file-hash enrichment directly to the automated Splunk response. At present, the automated detection passes:
alert_name
source_ip
destination_ip
destination_port
url
filename
into the response workflow, while VirusTotal enrichment is demonstrated separately.
A stronger pipeline could obtain the SHA-256 hash of the detected file and automatically query VirusTotal before deciding what information should be sent to MISP and TheHive.
The extended workflow could become:
Splunk Detection
↓
File Identified
↓
Calculate / Collect SHA-256
↓
VirusTotal Lookup
↓
Reputation Context
↓
MISP
↓
TheHive
This would bring the enrichment stage closer to the original architecture, where observable context is gathered before analyst investigation. The project already defines enrichment as a distinct stage between extraction and intelligence management.
2. Collect Richer Endpoint Telemetry
The current detection relies primarily on Windows Firewall telemetry.
That works well for validating a controlled network event, but it does not reveal everything happening on the endpoint.
A useful extension would be to introduce richer endpoint telemetry, such as Sysmon, as an optional additional data source.
This could provide information such as:
Process creation
↓
Network connection
↓
File creation
↓
File hash
↓
Parent / child process relationship
The detection could then correlate network activity with endpoint behaviour instead of relying only on the connection record.
For example:
Browser process
+
Connection to remote host
+
File created locally
+
SHA-256 recorded
↓
Higher-confidence detection
This would also reduce the need to construct fields such as the filename purely from known test context.
3. Replace the Scenario-Specific Detection with Behaviour-Based Logic
The current rule deliberately looks for the controlled .135:8080 activity so the pipeline can be reproduced reliably.
A future version could detect more general behaviour instead of one known destination.
For example, detection logic could evaluate:
New outbound connection
+
File retrieval behaviour
+
Unusual destination
+
Threat-intelligence context
↓
Detection candidate
Rather than asking: Did Endpoint-01 connect to 192.168.95.135:8080?
the system could begin asking: Did an endpoint retrieve a file from a destination
that deserves investigation?
That would make the detection reusable across more than one test scenario.
4. Process Multiple Splunk Results
The current controlled detection uses:
| head 1
so one normalized result enters the automation.
A future implementation should support multiple detections from the same scheduled-search execution.
For example:
Splunk Scheduled Search
↓
Result 1
Result 2
Result 3
↓
Bridge
↓
Validate each result
↓
Process individually
Each detection would need its own identifier or correlation key so the automation could distinguish separate events safely.
This would make the design much more suitable for environments where multiple endpoints or matching activities can appear within the same detection window.
5. Add Proper TheHive Case Deduplication
MISP already searches for an existing event before deciding whether to create or reuse intelligence. TheHive case creation is currently independent, so repeated scheduled detections can result in additional cases.
A future version could implement case correlation before creating a new investigation.
For example:
Detection Received
↓
Generate Correlation Key
↓
Search TheHive
↓
Matching Open Case?
↙ ↘
Yes No
↓ ↓
Update Case Create Case
↓ ↓
Add new Add initial
observation observables
The correlation key could be based on selected detection properties such as:
alert name
source
destination
filename
time window
This would make repeated detection handling more deliberate and reduce unnecessary investigation records.
6. Strengthen Automation Error Handling
Another improvement would be to make the workflow fail clearly when a downstream operation does not succeed.
A stronger response sequence would be:
Validate Input
↓
MISP Operation
↓
Success?
↙ ↘
Yes No → Log error → Exit non-zero
↓
TheHive Operation
↓
Success?
↙ ↘
Yes No → Log error → Exit non-zero
↓
Workflow Success
Each stage could use a distinct exit code, for example:
0 Successful workflow
2 Invalid detection input
3 MISP failure
4 TheHive failure
5 Enrichment failure
This would make both troubleshooting and automated monitoring easier because a successful process exit would more accurately represent the state of the entire workflow.
7. Add Retry and Rate-Limit Handling
External APIs are not always available.
VirusTotal, OTX, MISP, or TheHive requests may fail temporarily because of:
network interruption
API rate limits
temporary server errors
timeouts
service maintenance
Instead of immediately treating every failed request as permanent, the automation could implement controlled retries.
For example:
API Request
↓
Failed?
↙ ↘
No Yes
↓ ↓
Continue Wait
↓
Retry
↓
Maximum attempts?
Retries should remain limited so the automation does not create an endless loop or overload an external service.
8. Improve TLS and Secret Management
The lab already keeps API credentials outside the Python source code, which is a good separation for the current environment.
A stronger implementation could replace lab-specific certificate handling with trusted TLS certificates for every internal service and use a dedicated secret-management system rather than a local configuration file.
The architecture could evolve from:
Protected local secrets file
toward:
Automation
↓
Secret Manager
↓
Short-lived / controlled credentials
Credentials could also be scoped to dedicated service accounts with only the permissions required by the automation.
This would move the security model closer to how integrations should be handled in a larger environment.
9. Add More Detection Scenarios
The current project intentionally follows one controlled file-transfer scenario from start to finish. Once the architecture is stable, additional safe scenarios could reuse the same pipeline.
Examples include:
|
Scenario |
Possible telemetry |
|
Repeated failed logins |
Windows Security logs |
|
Suspicious PowerShell execution |
Process telemetry |
|
Connection to a known test IOC |
Firewall/network telemetry |
|
Unexpected administrative account use |
Windows Security logs |
|
Controlled file transfer |
Firewall + endpoint telemetry |
|
Unusual outbound connection |
Network telemetry |
Each scenario could have its own Splunk detection while continuing to use the same common response framework:
Detection A ─┐
Detection B ─┤
Detection C ─┤
↓
Normalized Interface
↓
Response Pipeline
↓
MISP + TheHive
This would demonstrate that the integration is reusable rather than tied to one alert.
10. Add Detection Severity and Decision Logic
The current workflow can also be extended beyond a simple match/no-match model.
Enrichment results could influence how the detection is handled.
For example:
Detection
↓
Enrichment
↓
Evaluate Context
↓
┌──────────────────────────────┐
│ Known malicious → High │
│ Suspicious → Medium │
│ Unknown → Review │
│ Known benign → Record │
└──────────────────────────────┘
↓
TheHive
This could influence:
case severity
case tags
case description
analyst priority
MISP attributes
The analyst would still make the final security judgement. The existing design already treats automation as a way to deliver structured evidence to the analyst rather than replace analyst decision-making.
11. Add Automated ATT&CK Suggestions
The current implementation keeps MITRE ATT&CK mapping analyst-driven, and the project explicitly avoids assigning unsupported techniques.
A future version could use detection metadata to suggest possible techniques without automatically treating them as confirmed.
For example:
Detection Evidence
↓
Mapping Rules
↓
Suggested ATT&CK Technique
↓
Analyst Review
↙ ↘
Accept Reject
↓
TheHive TTP
For the current scenario, the system might suggest:
T1105 – Ingress Tool Transfer
but the analyst would still review the evidence before attaching the technique to the case.
That preserves the evidence-based approach used throughout this project.
12. Add Pipeline Health Monitoring
A detection pipeline also needs visibility into its own health.
A future version could monitor:
Splunk ingestion status
Scheduled-alert executions
Bridge failures
Response-script failures
MISP API availability
TheHive API availability
External enrichment failures
A simple health dashboard could show:
|
Component |
Status |
|
Endpoint forwarding |
Healthy |
|
Splunk ingestion |
Healthy |
|
Detection scheduler |
Healthy |
|
Automation bridge |
Healthy |
|
MISP API |
Healthy |
|
TheHive API |
Healthy |
|
External enrichment |
Healthy |
This would make it easier to distinguish:
“No suspicious activity occurred”
From:
“The detection pipeline is broken and therefore detected nothing.”
That distinction becomes increasingly important as automation grows.
Possible Future Architecture
With these extensions, the lab could evolve toward:
Endpoint Telemetry
↓
Splunk
↓
Behaviour-Based Detection
↓
Normalized Detection
↓
Multiple-Result Processor
↓
Hash / Observable Extraction
↓
OTX + VirusTotal Enrichment
↓
Decision Logic
↓
MISP Correlation
↓
TheHive Case Correlation
↓
Analyst Investigation
↓
ATT&CK Suggestion
↓
Analyst-Validated Mapping
The current project establishes the foundation for this architecture by proving that Splunk detections can already move automatically into MISP and TheHive, while ATT&CK context is applied based on reviewed evidence.
Closing Note
The next step is not simply to add more security tools. The more valuable direction is to improve the quality of the data, detection logic, automation reliability, enrichment, correlation, and analyst context moving through the existing pipeline.
The current lab answers the first question:
Can these systems be connected into a working detection and investigation workflow?
The next version would answer a harder one:
How can that workflow become more reliable, scalable, evidence-rich, and useful across different detections?
That gives the project a natural ending without pretending the current implementation is production-ready.
Prefer the entire lab in one place?
Get the complete Threat-Intelligence-Driven Detection Lab as one structured PDF bringing all four parts, implementation steps, screenshots, architecture, validation, and technical notes together.
If this piece gave you something to think about, you can support my writing here ☕

каркасные дома санкт петербург станет комфортным и энергоэффективным решением для загородной жизни.
Большинство работ выполняется по заранее подготовленному проекту.
Поэтому под дом нередко выбирают облегченный фундамент подходящего типа.
План дома формируют с учетом нужной площади, числа этажей и образа жизни семьи.
Древесина должна быть хорошо высушена и обработана защитными составами.
Ремонт моторов — профессиональный ремонт и диагностика двигателей автомобилей.
На состояние мотора влияют пробег, качество масла и условия эксплуатации.
Проверка двигателя начинается с компьютерной диагностики и визуального осмотра.
Каждый этап ремонта должен выполняться аккуратно и с соблюдением технологии.
После ремонта необходимо применять моторное масло, соответствующее требованиям изготовителя.
Обращение в наркологическую клинику позволяет получить комплексную медицинскую помощь в одном месте. Специалисты оценивают физическое и психоэмоциональное состояние, определяют степень интоксикации и составляют программу лечения. При алкогольной зависимости первым этапом может стать вывод из запоя и капельница, при наркотической зависимости — детокс и снятие абстинентного синдрома. Далее обсуждаются методы дальнейшего лечения и профилактики рецидива.
Дополнительная информация – наркологическая клиника стационар Воронеж
Росгвардия охрана объектов — это надежное решение для обеспечения безопасности вашей собственности, росгвардия пультовая охрана.
Обеспечение безопасности объектов — одна из приоритетных задач Росгвардии, направленная на защиту граждан и государства.
Росгвардия охрана объектов — это надежное решение для обеспечения безопасности вашей собственности, услуги росгвардии.
В целом, деятельность Росгвардии в области охраны объектов обладает высокой важностью для стабильности страны.
Росгвардия охрана объектов — это надежное решение для обеспечения безопасности вашей собственности, росгвардия пультовая охрана.
Деятельность Росгвардии обеспечивает защиту имущества и сохранность важных объектов по всей стране.
Росгвардия охрана объектов — это надежное решение для обеспечения безопасности вашей собственности, вневедомственная охрана росгвардии цена.
Росгвардия является важным элементом системы национальной безопасности России, обеспечивая охрану объектов.
Росгвардия охрана объектов — это надежное решение для обеспечения безопасности вашей собственности, вневедомственная охрана стоимость.
Эффективная работа службы способствует сохранению общественного порядка и укреплению доверия населения.
Росгвардия охрана объектов — это надежное решение для обеспечения безопасности вашей собственности, охранная сигнализация росгвардия.
Росгвардия играет ключевую роль в обеспечении безопасности объектов различного назначения.
Росгвардия охрана объектов — это надежное решение для обеспечения безопасности вашей собственности, охранная сигнализация росгвардия.
Обеспечение безопасности объектов — одна из приоритетных задач Росгвардии, направленная на защиту граждан и государства.
Росгвардия охрана объектов — это надежное решение для обеспечения безопасности вашей собственности, охранная сигнализация полиция.
Росгвардия играет ключевую роль в обеспечении безопасности объектов различного назначения.
Росгвардия охрана объектов — это надежное решение для обеспечения безопасности вашей собственности, тарифы на вневедомственную охрану.
Основной задачей Росгвардии является охрана стратегических и важных объектов.
Росгвардия охрана объектов — это надежное решение для обеспечения безопасности вашей собственности, вневедомственная охрана московской области.
Основной задачей Росгвардии является охрана стратегических и важных объектов.
Росгвардия охрана объектов — это надежное решение для обеспечения безопасности вашей собственности, вневедомственная охрана услуги.
Деятельность Росгвардии обеспечивает защиту имущества и сохранность важных объектов по всей стране.
Росгвардия охрана объектов — это надежное решение для обеспечения безопасности вашей собственности, вневедомственная охрана сигнализация.
Росгвардия является важным элементом системы национальной безопасности России, обеспечивая охрану объектов.
Росгвардия охрана объектов — это надежное решение для обеспечения безопасности вашей собственности, услуги вневедомственной охраны.
Все мероприятия по обеспечению безопасности проводятся по строгим стандартам и инструкциям Росгвардии.
Росгвардия охрана объектов — это надежное решение для обеспечения безопасности вашей собственности, пультовая охрана мвд.
Работа Росгвардии включает в себя контроль за порядком и предотвращение правонарушений на объектах.